
Figure 4. Association between CYP2C19*17 and CYP2C19 enzyme activity by CYP2C19 diplotype.
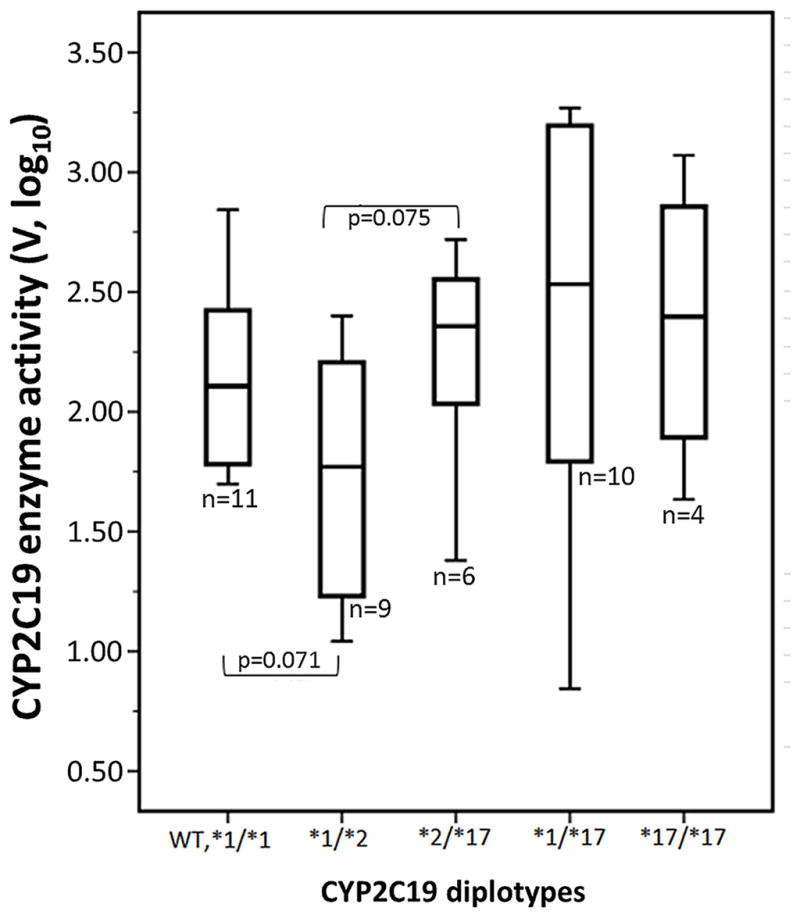
CYP2C19 enzyme activity was measured by conversion of S-mephenytoin to 4-hydroxymephenytoin in human liver microsomes. Data are presented as a box plot and whisker plot (box shows median with the 25th and 75th percentiles), and minimum and maximum values are shown by whiskers. Outliers that do not fall within the bounds of the plot and that are greater than three box-heights are indicated with ○ and *, respectively.