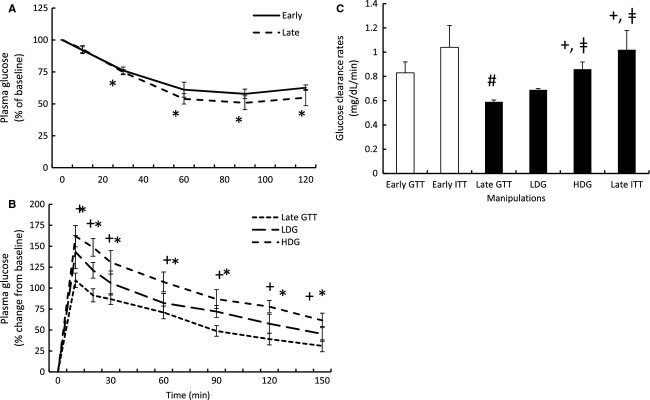
Figure 2.

Mean (±SE) plasma glucose (A) in response to early (n = 5) and late insulin infusions (n = 5), (B) in response to low- (LDG; n = 3) and high-dose (HDG; n = 4) glucagon-like peptide-1 (GLP-1) infusions plasma (GLP-1), and (C) the resulting glucose clearance rates (K) in response to the exogenous infusions. #denotes significantly (P < 0.05) different from early fasting; *denotes significantly (P < 0.05) different from baseline (T0); †denotes significantly (P < 0.05) different from late-fasting GTT; ‡denotes significantly (P < 0.05) different from LDG. Late GTT glucose, and early and late glucose clearance values adapted from (Viscarra et al. 2011a).
