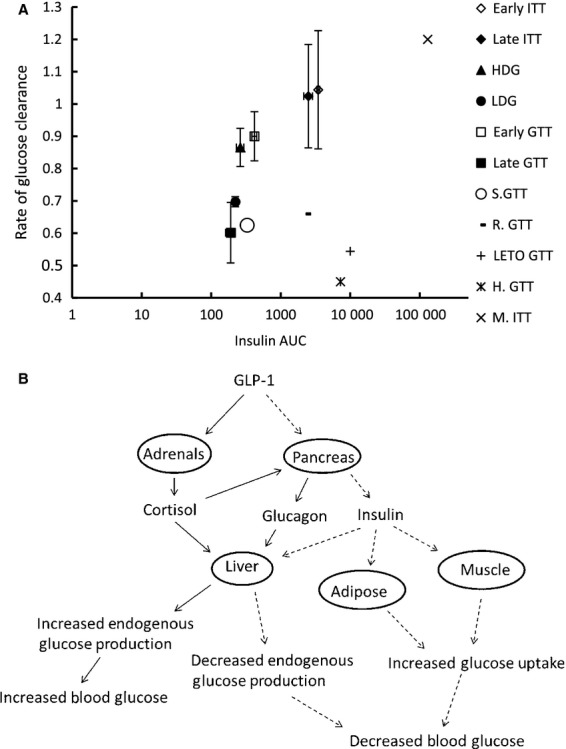
Figure 8.

(A) Relationship between mean insulin area under the curve (AUCinsulin) and mean glucose clearance (K) from the present study compared with values found in the literature for adult female elephant seals (S.GTT) (Fowler et al. 2008), Sprague-Dawley rats (R.GTT) (Harris and Apolzan 2012), Long Evans Tokushima Otsuka rats (LETO.GTT) (Rodriguez et al. 2012), humans (H.GTT) (Tura et al. 2001), and mice (M.ITT) (Wu et al. 2011). (B) Simplified schematic summarizing the effects of GLP-1 on the pancreas and adrenal glands with relation to their glucoregulatory capabilities. Solid lines are representative of steps leading to increased blood glucose, dashed lines are representative of steps leading to decreased blood glucose.
