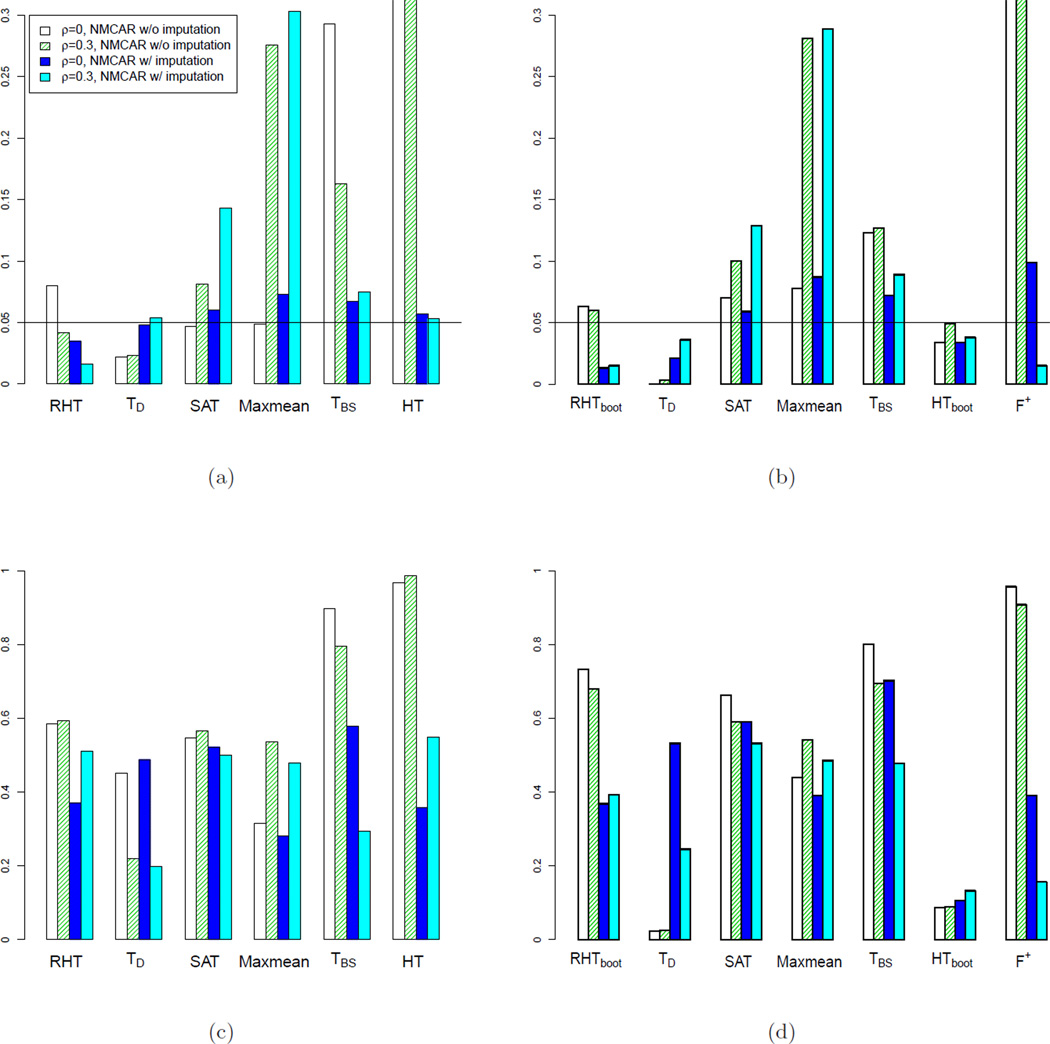
Figure 5.
Comparing type I error rates (a),(b) and power (c),(d) of competing tests at 0.05 p-value cutoff, with not-missing-completely-at-random (NMCAR). For (a) and (c), p = 20, n = 50. For (b) and (d), p = 20, n = 10. In both simulations, the correlation matrix Σ has diagonal elements: σii = 1, and off diagonal elements: σij = ρ (i, j = 1,…,p).

