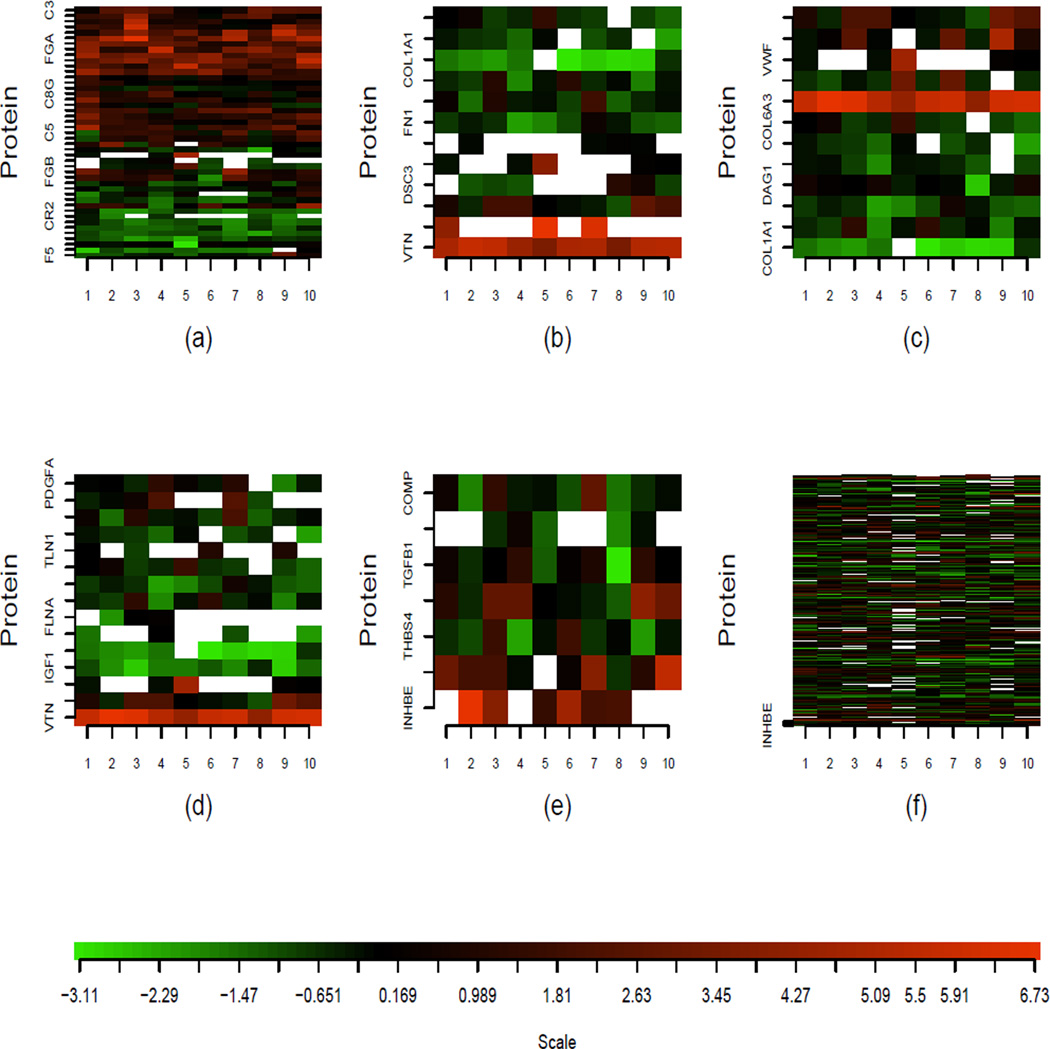
Figure 6.
Heatmaps of protein log concentration ratios from the five significant pathways and from all proteins in the data set. Each row represents the ratios from a protein and each column represents one IPAS experiment. Missing values are displayed in white. Positive, zero and negative log concentration ratios are shown in red, black, and green. (a)–(e) are the heatmaps of complement and coagulation cascades, cell communication, ECM receptor interaction, focal adhesion and TGF-beta signaling pathways, respectively. (f) is the heatmap of all proteins in the data.

