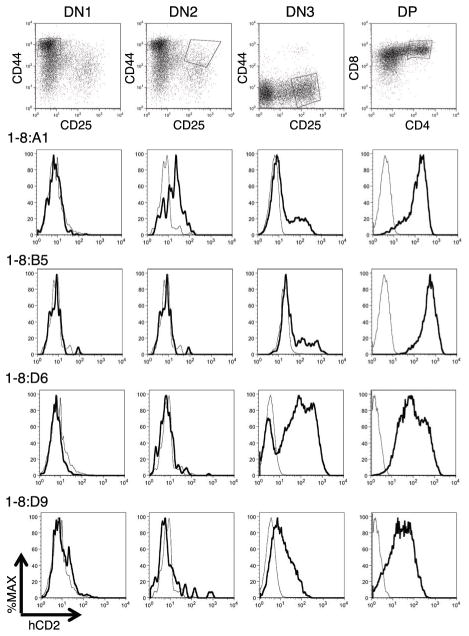
Figure 4. Appropriate upregulation of the hCD2:1-8 reporter gene at DN3 or during the DN3 to DP stage transition of in vitro T cell development.
Flow cytometry analysis of T cell development from four representative hCD2:1-8ESC clones (1-8:) differentiated in the OP9DL1 co-culture system. Cells were harvested on day 12 of co-culture to detect CD4, CD8 double negative (DN)1 (CD44+CD25neg) and DN2 (CD44+CD25+) stage T cells, or day 18 to examine DN3 (CD44negCD25+) and DP (CD4+CD8+) cells. Note that clone 1-8:A1 also appears in Figure 3. Representative target cell population gates are shown at top. hCD2 expression in gated transfected (dark curve) and non-transfected (light curve) cells is shown below in each column.

