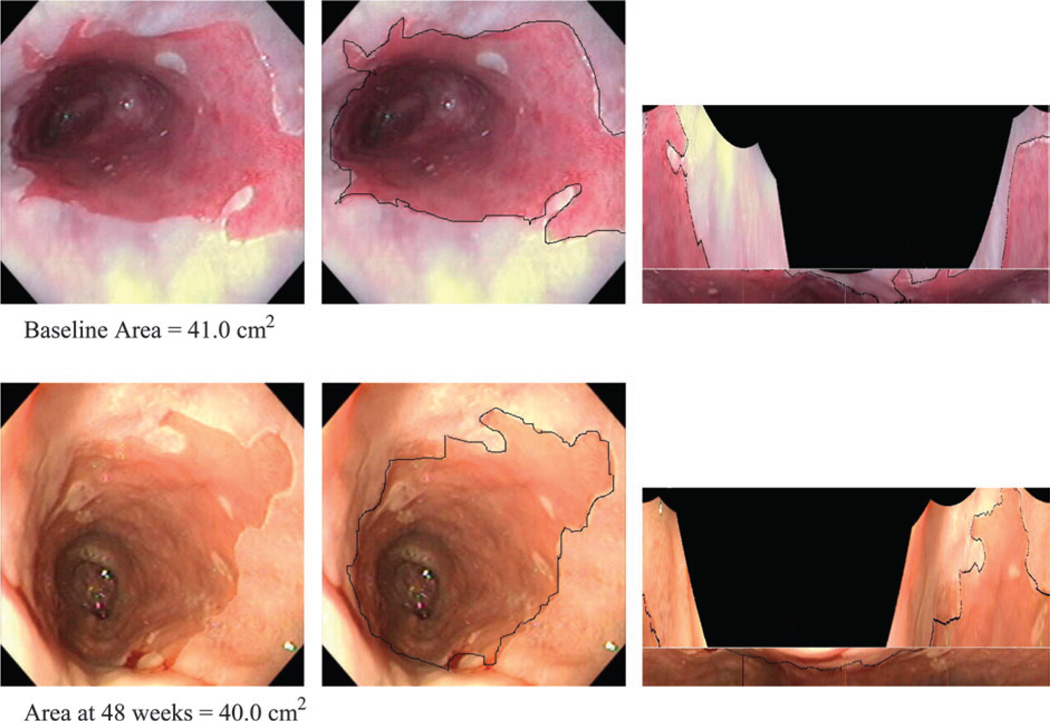
Fig. 1.
Operations and transformations for quantitative endoscopy. Two series of three images are shown. The first row was taken at baseline, and the second row was taken at the 48-week follow-up. The baseline and 48-week follow-up images were of the same region in the esophagus. Left) Image of Barrett’s esophagus. Middle) The image with the structures to be measured outlined. Right) Transformed images of Barrett’s esophagus into two-dimensional maps allowed for quantitative measurement of the surface area of Barrett’s esophagus.

