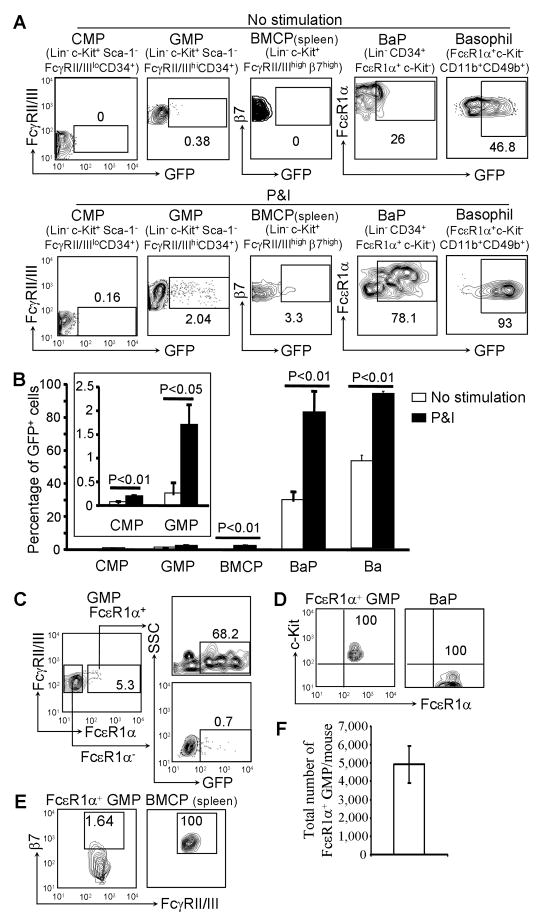
Figure 1. A Subset of GMPs Begins to Acquire the Capacity to Express the Il4 Reporter Gene.
(A) FACS analysis of GFP expression in progenitors of the bone marrow or the spleen prepared from Il4G4/+ mice. The numbers inside the FACS plots indicate the percentage within the gated populations. (B) The percentages of GFP+ cells within the gated populations (mean ± SD, n=3). (C) FACS sorted GMPs from the bone marrow of Il4G4/+ mice were stimulated with P&I for 6 hours and stained with APC-labeled anti-FcεR1α antibody. (D) c-Kit expression comparison between FcεR1α+GMPs and BaPs. (E) β7 expression comparison between FcεR1α+ GMPs and BMCPs in the spleen. (F) Total number of FcεR1α+ GMPs in two tibias and two femur bones per mouse (mean ± SD, n=6). Data are representative of three independent experiments with similar results. Also see Figure S1.

