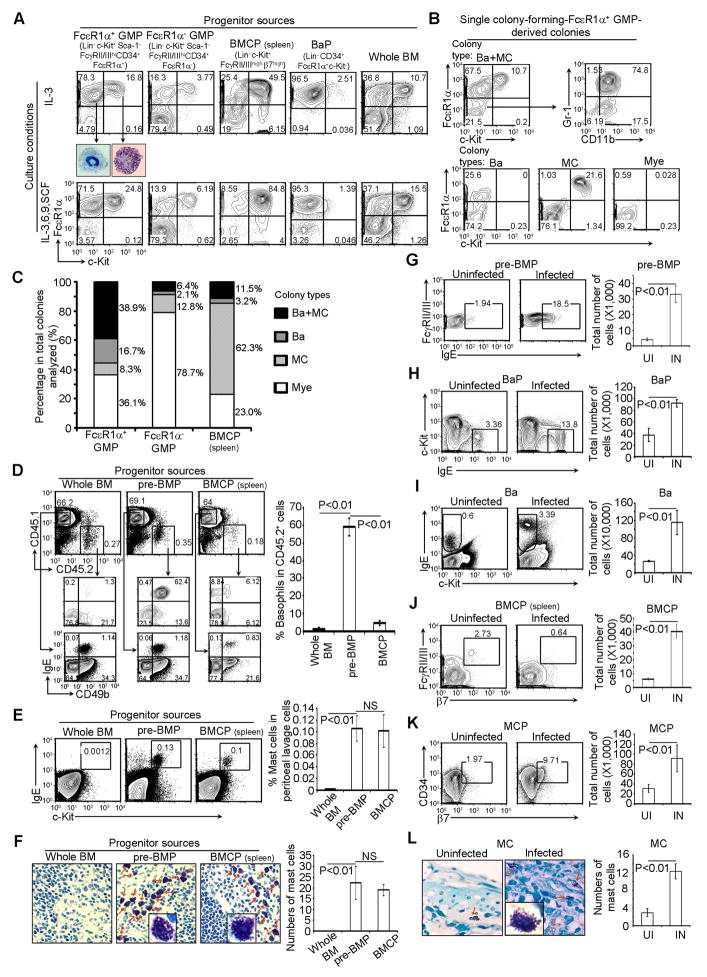
Figure 3. pre-BMP Populations Contain Highly Enriched Common Basophil-Mast Cells Progenitors.
(A) FcεR1α+ GMPs, FcεR1α− GMPs, and BaPs FACS-sorted from BM cells, BMCPs FACS-sorted from the spleen, and whole BM cells were cultured under the indicated conditions for 5 days. Basophils and mast cells sorted from FcεR1α+ GMPs cultured in IL-3 were stained by May-Grunwald Giemsa (40x). (B) Single colony-forming-FcεR1α+ GMP-derived colonies were analyzed by FACS. (C) Colony composition. Each type of colony was calculated as the percentage of total colonies analyzed. (D) FACS analysis of CD45.2+ basophils in the BM of pre-BMP-reconstituted CD45.1 recipient mice (mean ± SD, n = 3). (E) FACS analysis of mast cells from the peritoneal cavity of reconstituted Kitw–sh/w–sh mice (mean ± SD, n = 3). (F) Toluidine blue staining of spleen sections from reconstituted Kitw–sh/w–sh mice (40x, insert, 100x). Mast cells are indicated by red arrows. The right panel shows the average number of mast cells in five different fields (40x) randomly selected from the sections of spleens (mean ± SD, n = 3). (G-K) FACS analysis of pre-BMPs, BaPs, basophils, and MCPs in the bone marrow or BMCPs in the spleen (J) of mice uninfected (UI) or infected (IN) withS. mansoni for 7 weeks (left), and the total number of cells in two femur bones per mouse or in the spleen (right). Data represent the mean ± SD (n=5). (L) Mast cells in the large intestine of uninfected or infected mice were stained with toluidine blue (left, 40x, insert, 100x) and shows the average number of mast cells in five different fields randomly selected from the sections of large intestine (mean ± SD, n=3). Data represent three independent experiments with similar results. Also see Figure S2.

