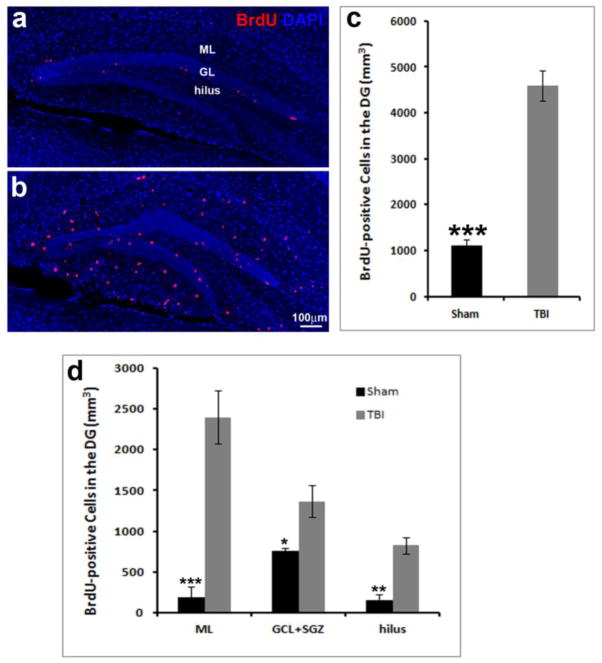
Figure 3. Spatial and temporal distribution of the proliferated cells.
5 weeks after TBI.
Immunostaining with an anti-BrdU (red) antibody to identify proliferated cells in the hippocampus of the sham control (a) or TBI mice (b) 5 weeks after surgery. Nuclei are stained with DAPI (blue) to show the hippocampal dentate gyrus (HDG) structure. (c) Quantification of BrdU-positive cells in the HDG following TBI. (d) Distribution of BrdU-positive cells in the HDG following TBI. GL: granule cell layer. ML: molecular layer. (*** p<0.0001; ** p<0.001; * p<0.01, n=5 for each group).

