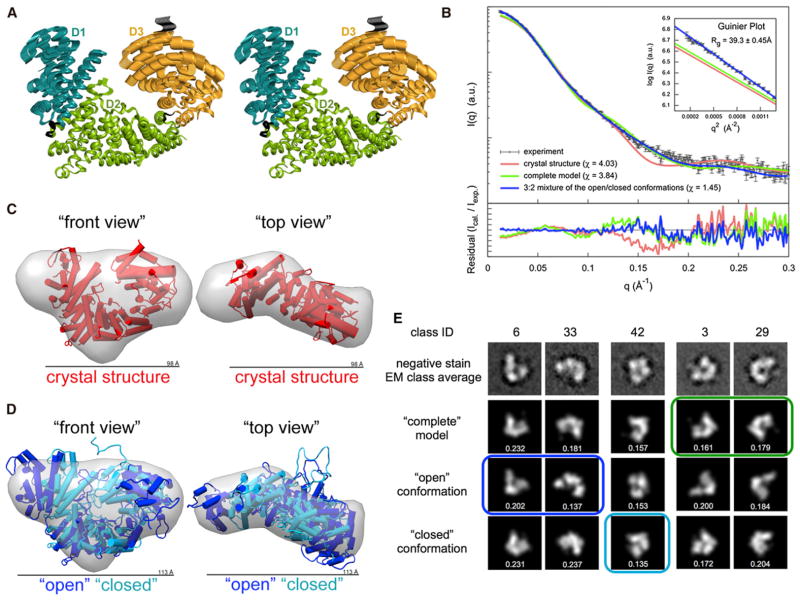
Figure 2. Conformational Flexibility of ScNup192(2–960).
(A) Stereoview of the top normal mode predicted by elNémo (Suhre and Sanejouand, 2004) is shown, depicting the motion of D1 and D3 domains relative to the D2 domain of ScNup192(2–960). Residues in the hinge regions 204–211 and 663–670, between the domains, are colored in black.
(B) Comparison of the merged experimental SAXS profile (black) of ScNup192(2–960) with the calculated SAXS profiles from the crystal structure (χ = 4.03, red), the “complete model” (χ = 3.84, green), and the 3:2 mixture of “open” and “closed” conformations (χ = 1.45, blue) are shown. The lower plot presents the residuals (calculated intensity/experimental intensity) of each calculated SAXS profile. The upper inset shows the SAXS profiles in the Guinier plot with an Rg fit of 39.30 ± 0.45 Å. The maximum particle size (Dmax) is 123 Å.
(C) The crystal structure shown as cylinders (in red, front and top views) was fitted to the ab initio shape (represented as a gray envelope) computed from the experimental SAXS profile. This comparison reveals extra volume in solution. See also Figure S3A.
(D) The “open” (in blue) and “closed” (in cyan) conformations of ScNup192(2–960) were fitted with the ab initio shape (represented as a gray envelope) computed from the experimental SAXS profile. The mixture of two conformation envelopes agrees well with the ab initio shape. See also Figure S3B and Movies S1, S2, S3, and S4.
(E) Selected negative stain EM class averages are shown along with the projections of the “complete model”, “open”, and “closed” conformations. The em2D scores are shown in the bottom of each projection. See also Figure S4, showing 44 EM class averages along with projection of the “complete model”, “open”, and “closed” conformations, and Figure S5, illustrating histogram of em2D scores for selected class averages.
See also Tables S1 and S2.

