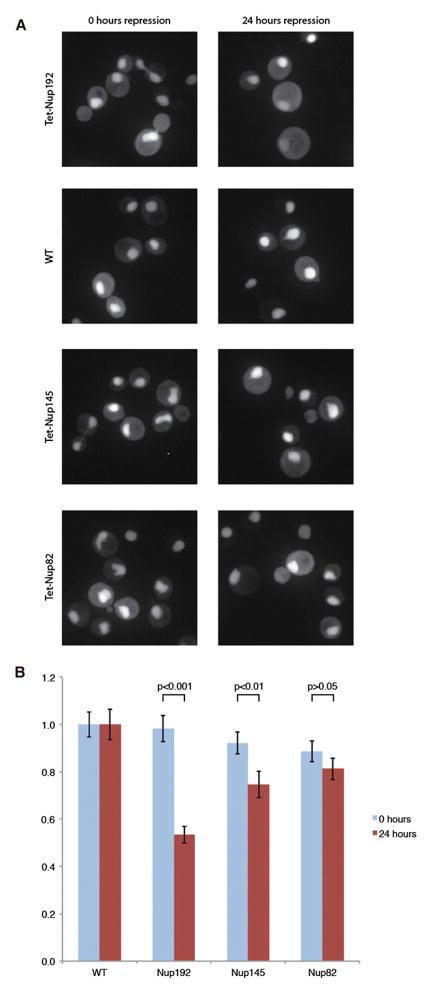
Figure 5. Steady State Localization of Transport Reporter after Depletion of Nup192.
(A) The different panels show the localization of the Nab2NLS-mCherry-PrA NPC function reporter protein in strains where Nup192, Nup145, or Nup82 levels were repressed with chlortetracycline. Example images of these strains are shown after 0 or 24 hr of repression.
(B) The N/C ratios of the reporter were quantified from ~100 cells per condition and normalized to a WT N/C value of 1 at the respective time point. These mean values are plotted with error bars of the standard error of the normalized means. Reported p values were the result of a Mann-Whitney rank sum test, comparing the distributions of normalized N/C values with or without repression. See also Figure S8.

