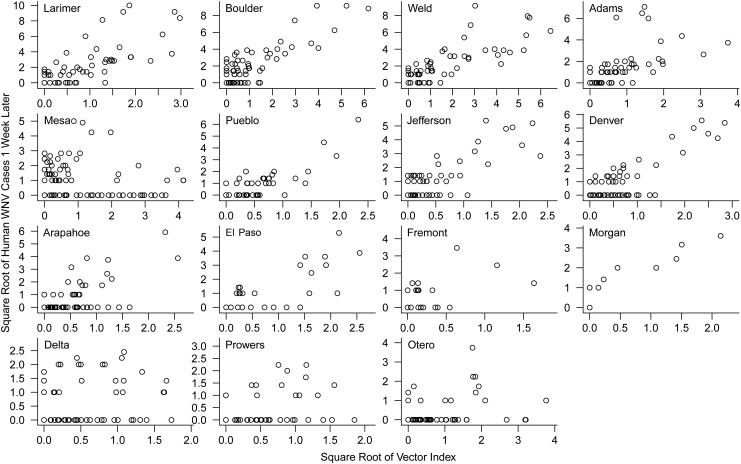
Figure 2.
Human West Nile virus (WNV) cases 1 week later plotted against the vector index (with a local 2-week estimate of prevalence) for 15 counties in Colorado, 2003–2007, ordered from left to right and top to bottom in order of total number of cases over the 5 years. Each point is 1 week, and axes are square root–transformed to equalize leverage, linearize the relationship, and facilitate presentation. (See Web Table 3 for quantification of these correlations and for the strength of correlation 2 and 3 weeks in advance.)

