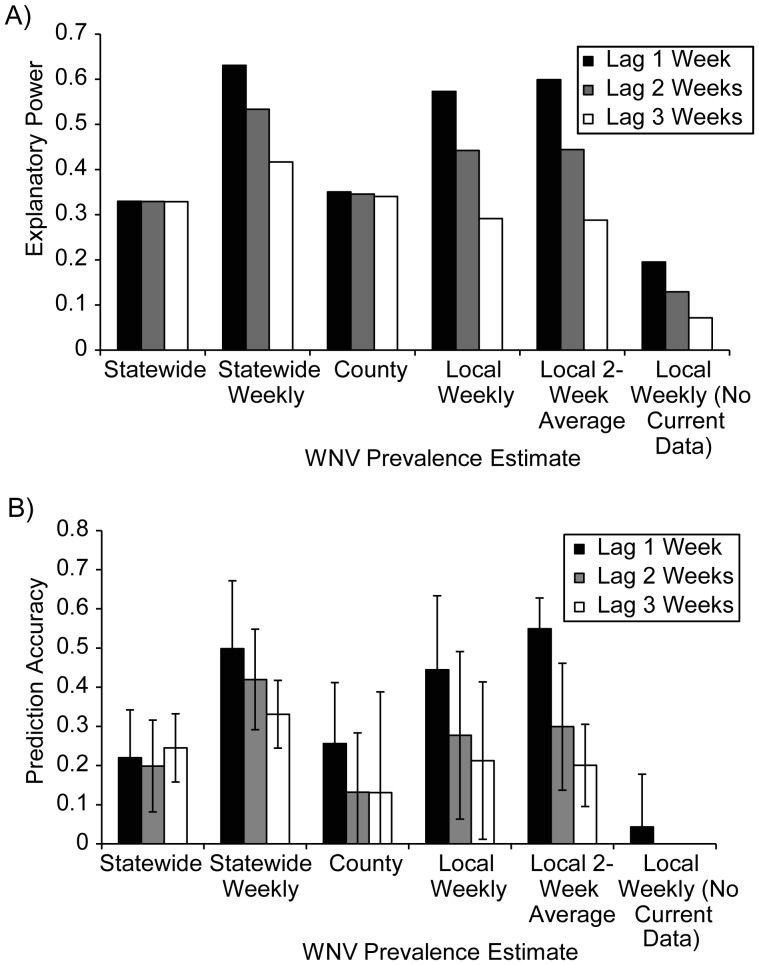
Figure 4.
Statewide analysis of human West Nile virus (WNV) cases versus vector indices. A) Explanatory power (pseudo-R2) of vector indices using various methods for estimating prevalence at 3 different time lags in the statewide analysis. B) Prediction accuracy (1 – (sum of squared residuals)/(total sum of squares)) of risk indices when excluding a 10% random subset of the data and then using the fitted model to predict the number of WNV human cases by using the excluded mosquito surveillance data. Mean prediction accuracy within 1 standard deviation from 100 random subsets is shown. For “Local Weekly (No Current Data),” the mean prediction accuracy for lags of 2 and 3 weeks was 0.

