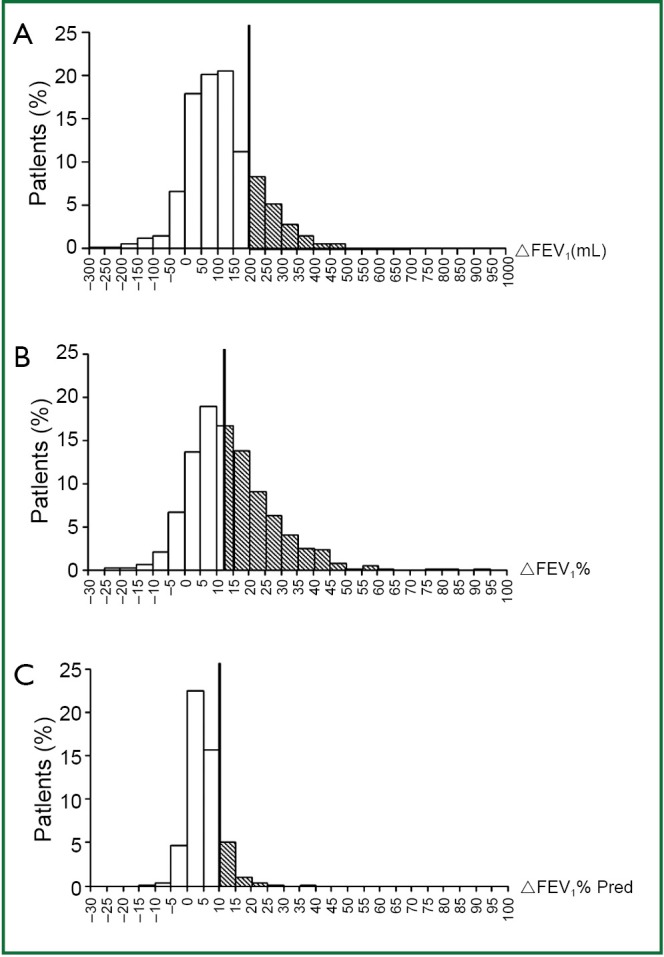
Figure 1.

Variation and distribution of ΔFEV1, ΔFEV1% and ΔFEV1% pred after bronchodilator inhalation. A. Vertical solid line is the limit of 200 mL on the abscissa and shadow area represents ΔFEV1 ≥200 mL in 22.3% of patients; B. Vertical solid line is the limit of 12% on the abscissa and shadow area represents ΔFEV1% ≥12% in 49.8% of patients; C. Vertical solid line is the limit of 10% on the abscissa and shadow area represents ΔFEV1%pred ≥10% in 13.5% of patients.
