
Figure 1.
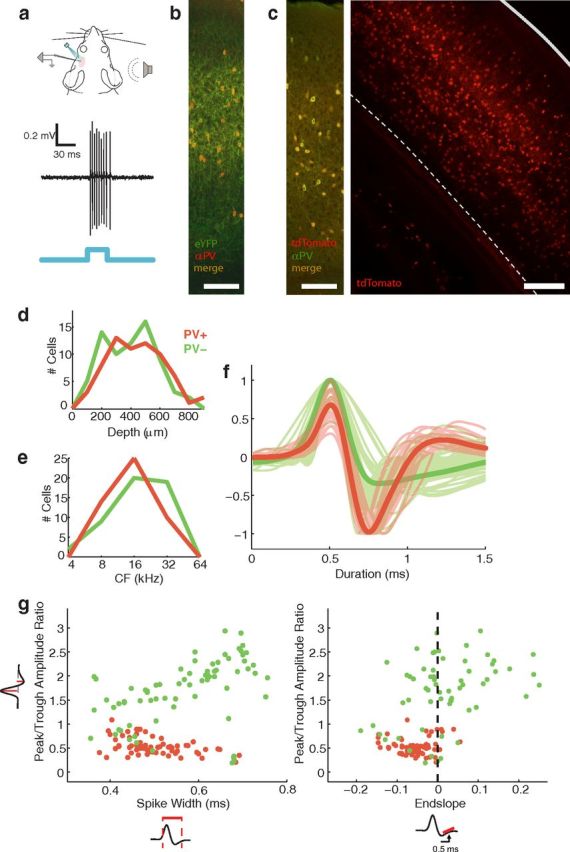
Identification of PV+ interneurons. a, We recorded from single neurons in the left auditory cortex of anesthetized ChR2-eYFP/PV-cre mice. PV+ neurons were identified as neurons that showed reliable, short latency responses to pulses of blue light. For comparison, we collected a sample of PV− neurons in the same animals, which did not respond to light. Light was delivered by an LED positioned directly over the recording site. Expression pattern and specificity. b, Immunostain for PV in ChR2-eYFP/PV-cre mice; section thickness 30 μm; scale bar, 100 μm. More than 97% of cells that stained positively for PV expressed eYFP (n = 657 cells in two mice, four sections total). c, PV-cre expression was visualized in a cross to a cytosolic tdTomato reporter line, where somata could be readily distinguished from processes. Left, Immunostain for PV in tdTomato/PV-cre mice; section thickness 30 μm; scale bar, 100 μm. More than 97% of cells expressing tdTomato stained positively for PV; >96% of cells that stained positively for PV expressed tdTomato (n = 638 cells in one mouse, four sections). Right, Coronal section through auditory cortex; section thickness 200 μm, processed with Sca/e (Hama et al., 2011). Solid line indicates pial surface; dashed line indicates white matter boundary; scale bar, 200 μm. PV+ cells were distributed throughout layers II–VI. d, We sampled PV+ (red, n = 68) and PV− cells (green, n = 72) from all cortical layers. e, We sampled PV+ and PV− cells across the tonotopic extent of A1. f, Average extracellular waveforms for individual PV+ (red) and PV− neurons (green). Bold lines show group averages. Waveforms were normalized to peak or trough, whichever was larger. g, Scatter plots show the distribution of spike waveform characteristics for PV+ and PV− cells: spike width and endslope are plotted on the x-axes; peak/trough amplitude ratio is plotted on the y-axis. Spike width was measured from 20% of the peak to 20% of the trough. PV+ cells tended to have narrow waveforms, low peak/trough amplitude ratios, and negative endslopes, although the two groups showed considerable overlap in all three measures.