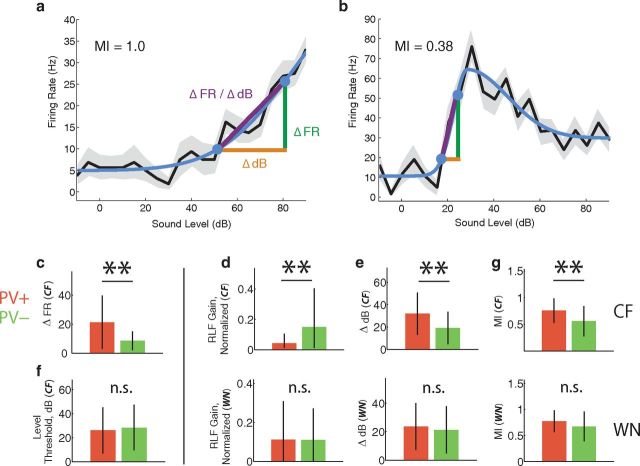
Figure 4.
RLFs. Example rate-level functions for (a) a monotonic, and (b) a nonmonotonic PV+ neuron, for responses to tones at CF. Best intensity was 90 dB in a and 30 dB in b. SEM is shown in gray. Fitted curves, shown in blue, were generated with a six-parameter split Gaussian model (Watkins and Barbour, 2011). Threshold (20% of maximum) and saturation points (80% of maximum) are indicated by filled circles on the curves. Firing rate dynamic range (Δ FR) and sound level dynamic range (Δ dB) are indicated by the green and orange bars. The slope of the rate-level function (Δ FR/Δ dB) is shown in purple. c, PV+ neurons had a greater dynamic range in firing rate (also true for white noise; data not shown). Error bars are SD. f, Tone intensity thresholds for PV+ and PV− neurons were not significantly different. d, e, g, Top, Compares rate-level function parameters for PV+ and PV− cells at CF; bottom, compares the same parameters for white noise. d, RLFs normalized to maximal evoked firing rate. For CF tones, PV+ neurons had a shallower gain than PV− neurons (Δ FR /Δ dB). e, PV+ neurons had greater sound level dynamic range for CF tones. g, PV+ neurons had more monotonic CF rate-level functions (monotonicity index, MI). White noise rate-level functions (bottom) showed a different pattern of results: PV+ and PV− neurons were not significantly different in terms of response gain (d, bottom), sound level dynamic range (e, bottom), or monotonicity (g, bottom).

