Figure 1.

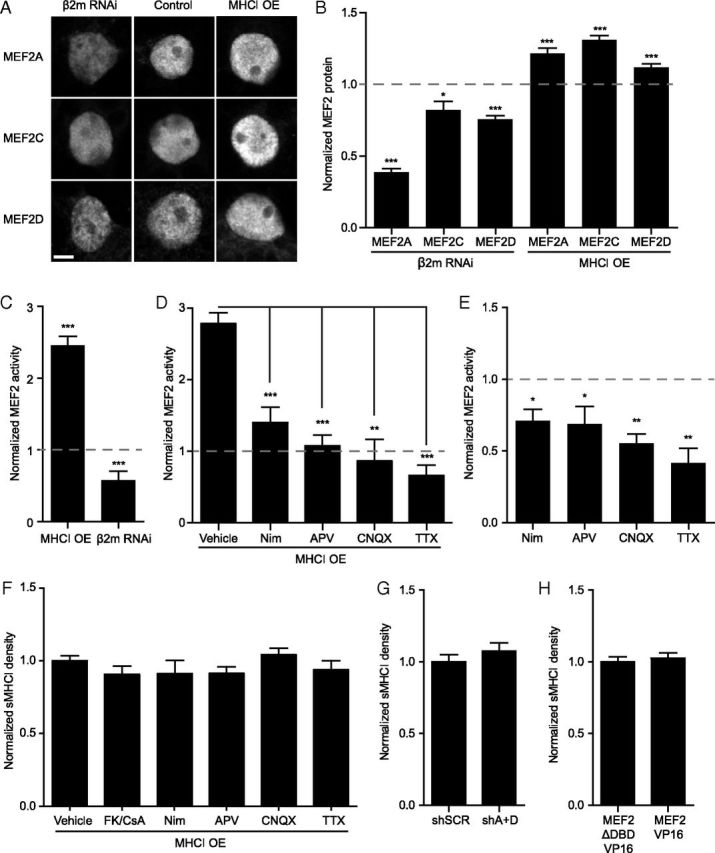
MHCI regulates the levels and activity of MEF2. A, Representative confocal micrographs of MEF2 proteins. Neurons were transfected with H2-Kb-YFP (MHCI OE) or siRNAs for β2m to knockdown sMHCI for 48–72 h (Glynn et al., 2011). Scale bar, 5 μm. B, MHCI regulates MEF2 protein levels. MHCI OE increased levels of nuclear MEF2A, -C, and -D, while decreasing sMHCI (using β2m RNAi) lowered MEF2. MEF2 protein was quantified and plotted normalized relative to the appropriate control group indicated by the dashed line at 1.0 (EGFP for MHCI OE and NTS siRNA for β2m RNAi; n ≥ 25 cells per condition, ≥2 experiments). C, MHCI also regulates MEF2 transcriptional activity. MEF2 activity was quantified after transfecting 7 DIV neurons with H2-Kb-mCherry or β2m siRNAs with the MEF2 transcriptional reporter 3xMRE-EGFP for 36–48 h. EGFP fluorescence intensity was measured and plotted normalized to the appropriate control group indicated by the dashed line at 1.0 (pmCherry for MHCI OE or NTS RNAi + pmCherry for sMHCI KD; n ≥ 31 cells per condition, ≥ 2 experiments). D, The MHCI-induced increase in MEF2 activation is activity-dependent. MEF2 activity following MHCI OE was analyzed as in C), with the indicated pharmacologic manipulations. Drugs or vehicle control were added post-transfection and MEF2 activity was quantified 36–48 h later and normalized to treated controls; n ≥ 21 cells per condition, ≥2 experiments. E, MEF2 is activated by synaptic activity and Ca2+ influx through L-VSCCs. Neurons were transfected with pmCherry and 3XMRE-EGFP at 6 DIV, and cells were fixed and analyzed at 8 DIV. Drugs were added as in D, and MEF2 activity was quantified 36–48 h later; n ≥ 8 cells, ≥2 experiments. F, sMHCI overexpression is not dependent on synaptic activity or Ca2+ influx through L-VSCCs or CaN activation. Neurons were transfected with H2-Kb-YFP at 6 DIV. Inhibitors of CaN (FK506/CsA), L-VSCCs (Nim), NMDARs (APV), AMPARs (CNQX), and Na-dependent action potentials (TTX) were added 1 h post-transfection as in D and sMHCI on transfected cells was quantified 48 h later; n ≥ 8 cells, two experiments. G, MEF2 knockdown does not alter sMHCI density. sMHCI density was quantified 48 h after transfection of MEF2A+MEF2D shRNAs (shA+D) or a scrambled shRNA control (shSCR); n ≥ 22 cells per condition, ≥2 experiments. H, MEF2 activation also does not alter sMHCI density. MEF2-VP16 was expressed for 48 h and sMHCI was measured relative to cells expressing a mutant form of MEF2-VP16 unable to bind to DNA, MEF2-ΔDBD-VP16. *p < 0.05, **p < 0.01, ***p < 0.001.
