Figure 4.
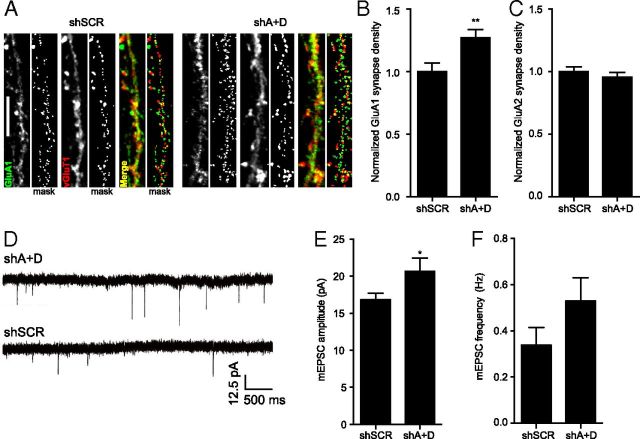
MEF2 limits synaptic strength and synaptic GluA1 content. A, Representative images of synapse density defined by colocalized GluA1 and VGluT1 in 8 DIV neurons transfected with shSCR or shA+D at 6 DIV. B, MEF2 A+D knockdown increases the density of GluA1-containing synapses compared with shSCR-expressing cells; n ≥ 44 dendrites (15 cells) per condition, two experiments. C, GluA2 synapse density was unchanged following MEF2A+D knockdown; n ≥ 38 dendrites (13 cells) per condition, two experiments. D, Representative traces of mEPSCs from cells expressing shSCR or shMEF2A+D shRNAs. E, F, MEF2 A+D knockdown significantly increases mEPSC amplitude (E), but not frequency (F); n ≥ 16 cells per condition, five experiments. *p < 0.05, **p < 0.01.

