Figure 9.

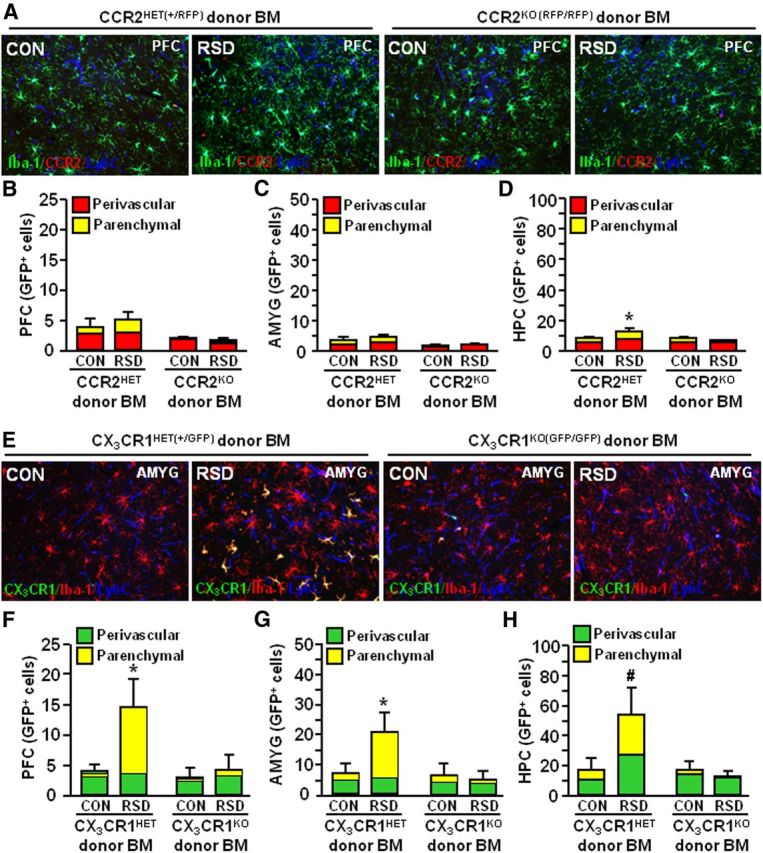
Expression of CCR2 and CX3CR1 on peripheral myeloid cells was required for RSD-induced macrophage infiltration into the brain parenchyma. WT recipient mice received either CCR2HET(+/RFP), CCR2KO(RFP/RFP), CX3CR1HET(+/GFP), or CX3CR1KO(GFP/GFP) BM-derived donor cells. BM-chimeric mice were subjected to six cycles of social defeat (RSD) or left undisturbed as controls (CON). The neuroanatomical distribution of GFP+ cells was determined 14 h after the final cycle of RSD (n = 3–6, 2 independent experiments). A, Representative merged images of Iba-1 (green)/CCR2 (red)/Ly6C (blue) immunofluorescence in the PFC of CON or RSD mice that received CCR2HET and CCR2KO donor BM. B–D, Quantification of the total number of perivascular and parenchymal cells in the PFC (B), AMYG (C), and HPC (D). E, Representative merged images of CX3CR1 (green)/Iba-1 (red)/Ly6C (blue) immunofluorescence in the AMYG of CON or RSD mice that received CX3CR1HET or CX3CR1KO donor BM. F–H, Quantification of the total number of perivascular and parenchymal GFP+ cells in the PFC (F), AMYG (G), and HPC (H). Bars represent the mean ± SEM. Means with asterisk (*) are significantly different from CON (p < 0.05) and means with number sign (#) tend to be different from CON (p = 0.06).
