
Figure 1.
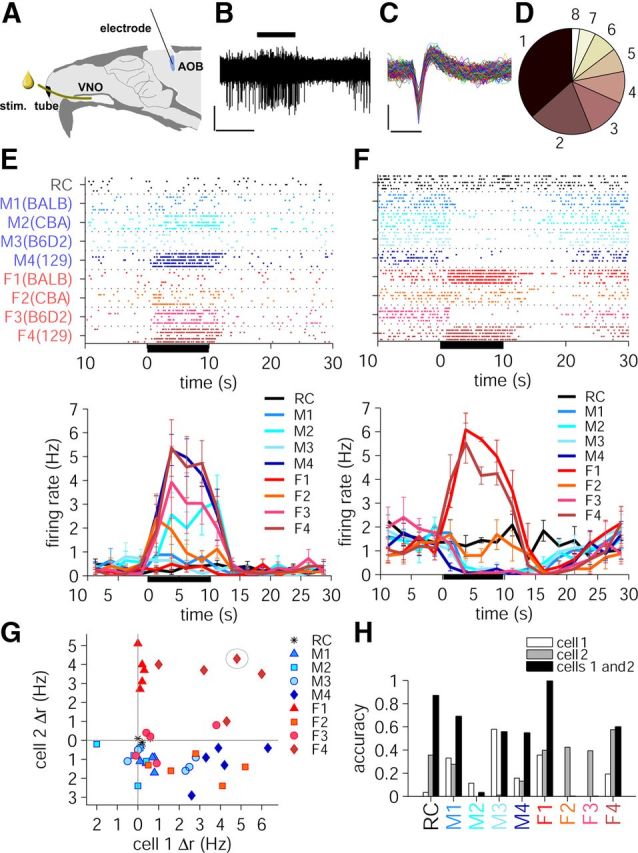
Recording from AOB and using responses of individual neurons to distinguish between stimuli. A, Experimental AOB recording setup: dilute urine from male and female mice of four different strains and Ringer's saline are delivered through a stimulus tube in random order to the VNO of the anesthetized female B6D2F1 mouse while AOB neuronal responses are recorded using 16 channel Neuronexus electrodes. B, Application of a urine stimulus to VNO for 10 s (horizontal black bar, top; female 129Sv urine) results in a neuronal firing rate increase in AOB. Calibration: 50 μV, 10 s. C, Single-unit neuronal spikes from complete recording, partially represented in B. Calibration: 50 μV, 1 ms. D, Proportion of neurons that responded to one or more stimuli. E, F, Raster plots (top) and peristimulus time histograms (bottom) of firing rate of two example cells in response to 10 s presentation of stimulus. The mean ± SD is shown. The stimulus naming convention is shown in D: strains BALB/c, CBA, B6D2, and 129Sv are renamed 1, 2, 3, and 4, respectively. The same convention applies in all subsequent figures. G, Firing rate responses, Δr, of two example neurons from E and F (here called Cell 1 and Cell 2, respectively) calculated over the 10 s stimulus presentation period. Each point is the Δr resulting from one stimulus repeat. Tight clustering of points for the same stimulus (e.g., red triangles, F1, female BALB/c urine) corresponds to a reliable response. On the other hand, high degree of scatter (e.g., red-orange squares, F2, female CBA urine) generally corresponds to high trial-to-trial variability. The circled point shows one of the five trials of female 129Sv urine (stimulus that yielded large responses in both neurons.) H, Stimulus classification accuracy of individual and combined cells 1 and 2, calculated using normalized Δr and the k nearest neighbors algorithm (see Materials and Methods). RC, Ringer's control.