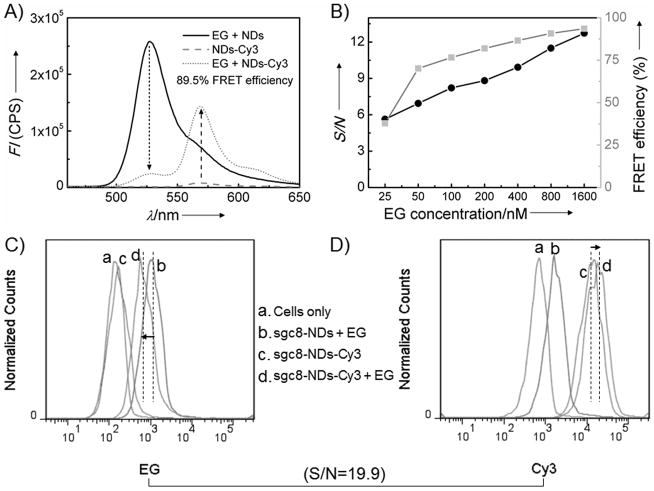
Figure 2.
Development and determination of the energy transfer efficiency of FRET DNA nanodevices built on target cell surfaces. A, Fluorescence spectrometric results indicating energy transfer on aptNDs with chemically-labeled Cy3 (acceptor) on M1 and M2 and physically-associated EG (donor) in the duplex. Arrows denote the fluorescence changes (aptNDs: 20 nM; EG: 800 nM; Ex: 440 nm). B, FRET efficiency (gray) and S/N (black) of these aptNDs with a series of EG concentrations (aptNDs: 20 nM; Ex: 440 nm). C–D, Flow cytometric results indicating the anchoring of FRET aptNDs on target CEM cell surfaces by monitoring EG (C) and Cy3 (D) signals. Dotted lines denote the geometric mean fluorescence signal intensities, and arrows indicate signal changes. S/N was calculated as 19.9 (EG: 1 μM; aptNDs: 50 nM; Ex: 488 nm).

