
Fig. 3.
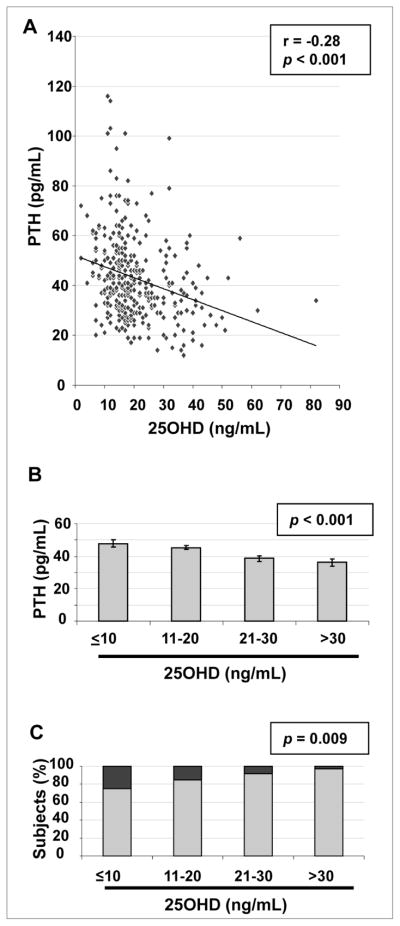
A, Scatterplot and regression line of 25-hydroxyvitamin D [25(OH)D] with parathyroid hormone (PTH). B, Mean PTH ± standard error of the mean (SEM) by 25(OH)D at the thresholds indicated. C, Percentage of subjects at each 25(OH)D threshold with PTH ≤60 pg/mL (light gray) and with PTH >60 pg/mL (dark gray).