
Figure 1.
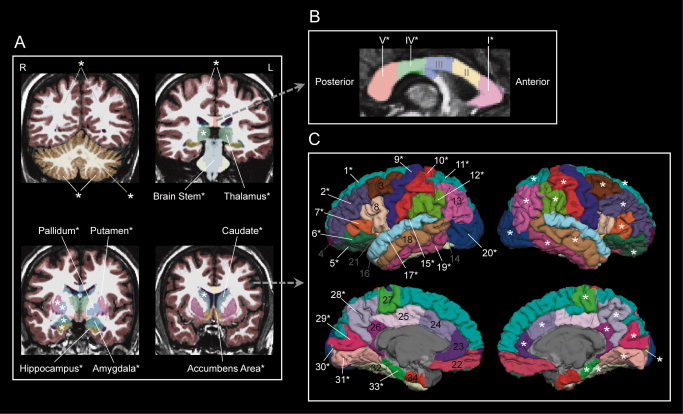
Cortical and subcortical ROIs examined in this study. * : ROI exhibiting significant (P < 0.05) group effect in the ANOVA analysis (see details in “Methods” section). A: Gross volumes (the left and right cerebral cortex and white matter, the left and right cerebellar cortex and white matter) and subcortical ROIs. R: right hemisphere, L: left hemisphere. B: Five portions of corpus callosum. I: anterior, II: midanterior, III: central, IV: midposterior, V: posterior. C: Thirty‐four ROIs on the cerebral cortex. 1: superior frontal gyrus, 2: rostral middle frontal gyrus, 3: caudal middle frontal gyrus, 4: frontal pole, 5: lateral orbital frontal cortex, 6: pars orbitalis, 7: pars triangularis, 8: pars opercularis, 9: precentral gyrus, 10: postcentral gyrus, 11: superior parietal lobule, 12: supramarginal gyrus, 13: inferior parietal lobule, 14: banks of superior temporal sulcus, 15: transverse temporal gyrus, 16: temporal pole, 17: superior temporal gyrus, 18: middle temporal gyrus, 19: inferior temporal gyrus, 20: lateral occipital cortex, 21: insula, 22: middle orbital frontal cortex, 23: rostral anterior cingulate cortex, 24: caudal anterior cingulate cortex, 25: posterior cingulate cortex, 26: isthmus of cingulate cortex, 27: paracentral lobule, 28: precuneus cortex, 29: cuneus cortex, 30: pericalcarine cortex, 31: lingual gyrus, 32: fusiform gyrus, 33: parahippocampal gyrus, and 34: entorhinal cortex.