
Figure 2.
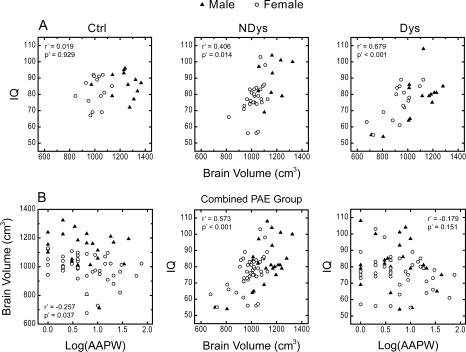
Correlation between PAE, alteration in brain and alteration in behavior. r′, P′: correlation coefficient and significance level when controlling the gender factor. A: Whole brain volume and IQ. Ctrl: control group, NDys: nondysmorphic group, Dys: dysmorphic group. B: Relationship between PAE, whole brain volume and IQ for the combined PAE group. Log(AAPW): Log10 of absolute alcohol per week (ounces).