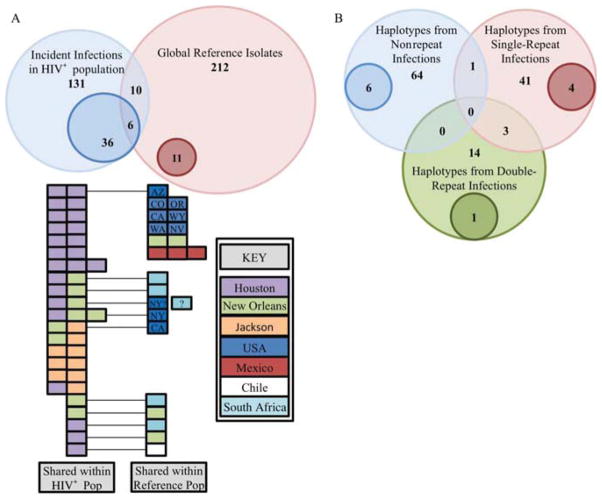
Figure 1.
(A) Venn diagram representing the distribution of unique and shared haplotypes among the HIV+ population and the global reference population. The light blue and light red circles represent the number of isolates comprising the HIV+ population and the global reference population, respectively. The darker blue and red circles within the light circles indicate the number of isolates that have haplotypes that are shared by multiple Trichomonas vaginalis strains within the population. The numbers within the overlapping regions indicate the number of isolates that have haplotypes that were detected in those categories (eg, there are six haplotypes that are shared among multiple HIV+ hosts and hosts from the global reference population). The colour-coded boxes below indicate the regions in which each of the shared haplotypes was identified. The isolates shared between HIV+ populations and reference populations are connected to their counterparts with a black line. (B) Venn diagram representing the relationship of parasite haplotypes among non-repeat, single-repeat and double-repeat infections. The light blue, light red and light green circles indicate the number of haplotypes among the non-repeat infections, single-repeat infections and double-repeat infections, respectively. The darker blue, red and green circles within the light circles represent the haplotypes that are shared by multiple T vaginalis strains from the same category of repeat infection. The numbers within the overlapping regions indicate the number of haplotypes shared between these groups (eg, there are three haplotypes that were isolated from both women with double-repeat infections and from women with single-repeat infections).

