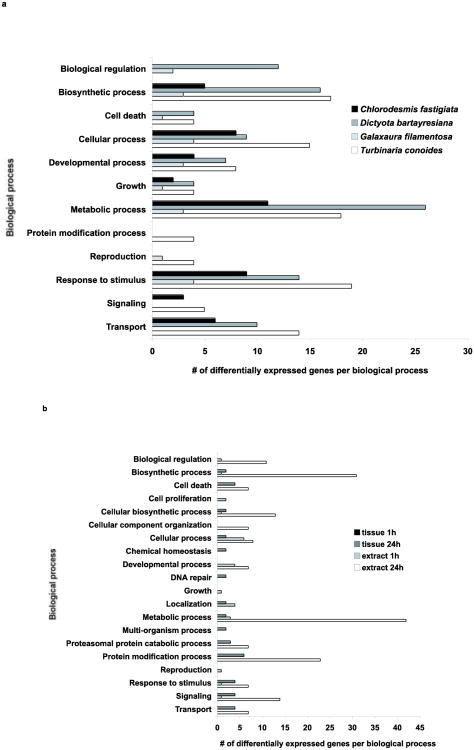
Figure 3.
Distribution of differentially expressed genes across biological process gene ontology according to Blast2Go after exposure to macroalgae for 20 d (a) or to Chlorodesmis fastigiata thalli or extracts for 1 h or 24 h (b). Different biological processes are included on each figure since two different array platforms were used for the long-term and short-term experiments.

