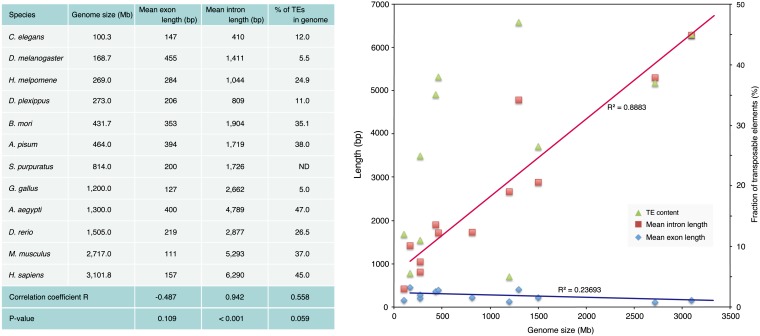
Figure 2.
Relationships between genome size and average intron/exon lengths for various model species. To calculate the average intron and exon lengths for 11 species other than B. mori (D. melanogaster, C. elegans, M. musculus, H. sapiens, D. plexippus, H. melpomene, G. gallus, A. aegypti, Acyrthosiphon pisum, Strongylocentrotus purpuratus, and Danio rerio), the GTF-formatted gene annotation files were downloaded from the Ensembl ftp site ftp://ftp.ensembl.org and processed with a custom Perl script. Triangles denote the TE content.

