Figure 4.
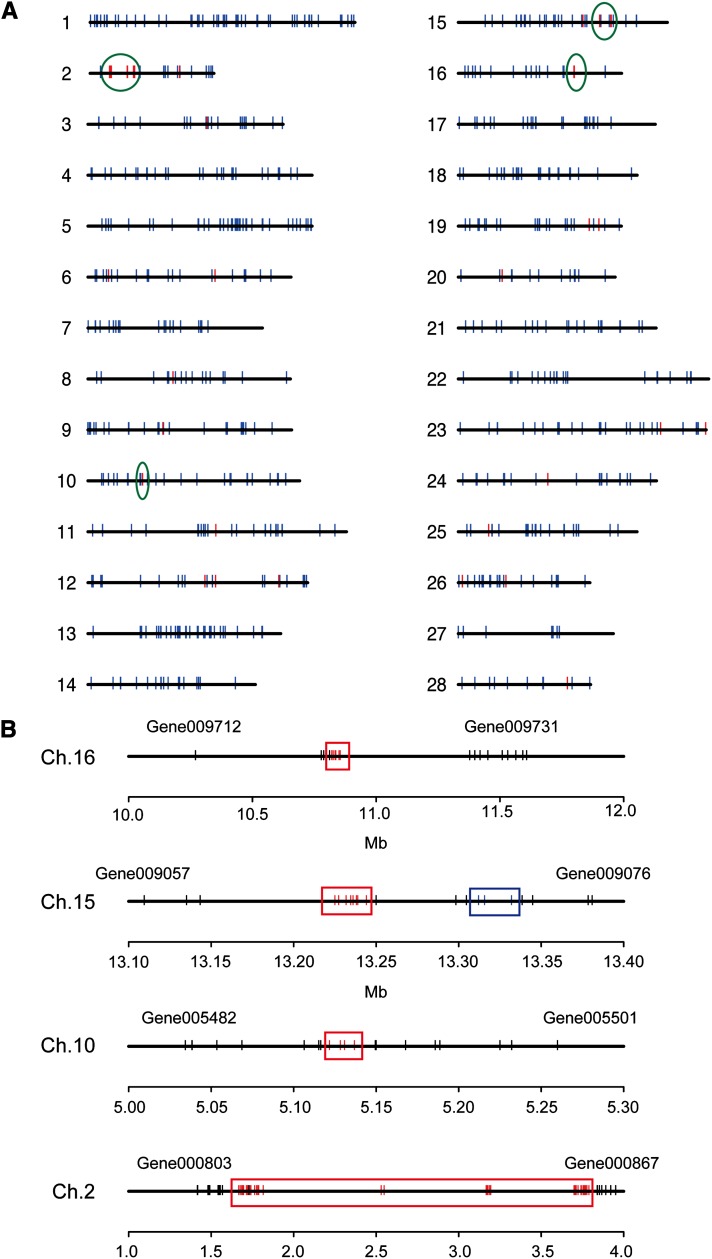
Sexual dimorphism in mapping of ovary-/testis-specific genes. (A) Chromosomal distribution of testis-specific (blue) and ovary-specific (red) genes. The ovary-specific gene clusters on ch.2, 10, 15, and 16 are circled in green and are presented with enlarged views in panel B. (B) Ovary-specific gene clusters on ch.2, 10, 15, and 16. Red bar, blue bar, and black bar denote ovary-specific gene, testis-specific gene, and nontissue-specific gene, respectively.

