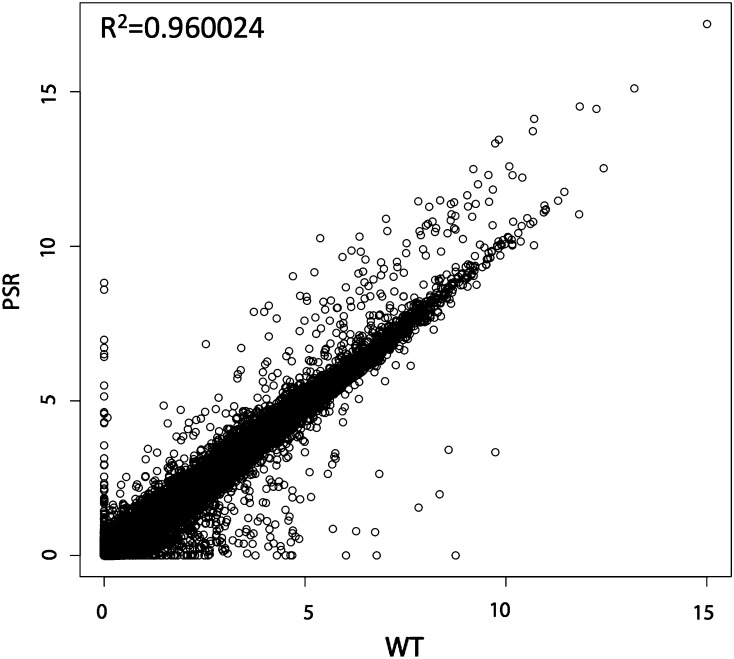
Figure 2.
Scatter plot of PSR vs. WT testes with coefficient of determination. Scatter plot of fragments per kilobase of exon per million fragments mapped values for genes and NTRs comparing expression values for PSR (Y-axis) and WT (X-axis) testes. The coefficient of determination (R2) is displayed in top left.

