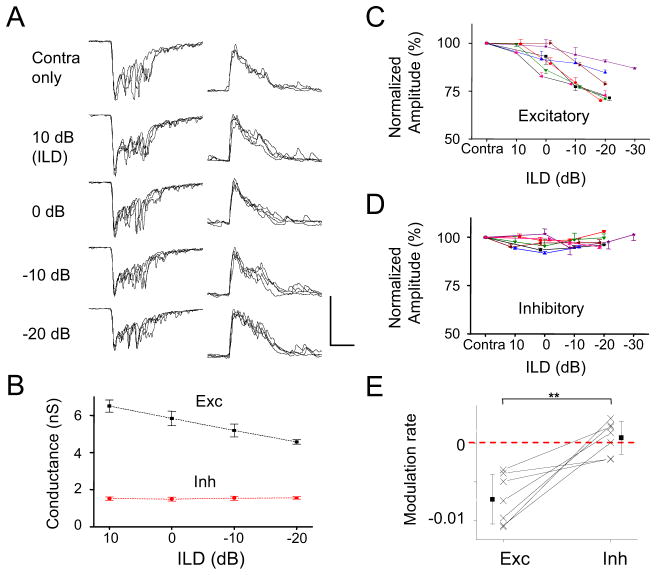
Figure 7. Synaptic responses underlying ILD-dependent gain modulation.
(A) Superimposed CF-tone evoked synaptic responses of five repetitions under contralateral stimulation only and binaural stimulation at different ILDs in an example cell. Scale: 450 pA (left)/100 pA (right), 50 ms.
(B) The mean ± SD of peak synaptic response amplitude at different ILDs for the cell shown in (A).
(C) The mean ± SD of peak excitatory response amplitudes for contralateral stimulation and binaural stimulation at different ILDs in seven cells. Each color represents one individual cell.
(D) The mean ± SD of peak inhibitory response amplitudes for the same seven cells.
(E) The rate of modulation (/dB). It is calculated by subtracting the level of binaural response at ILD = 0 dB from that at ILD = −20 dB, then divided by 20. Solid symbols represent mean ± SD. **p < 0.01, paired t-test.

