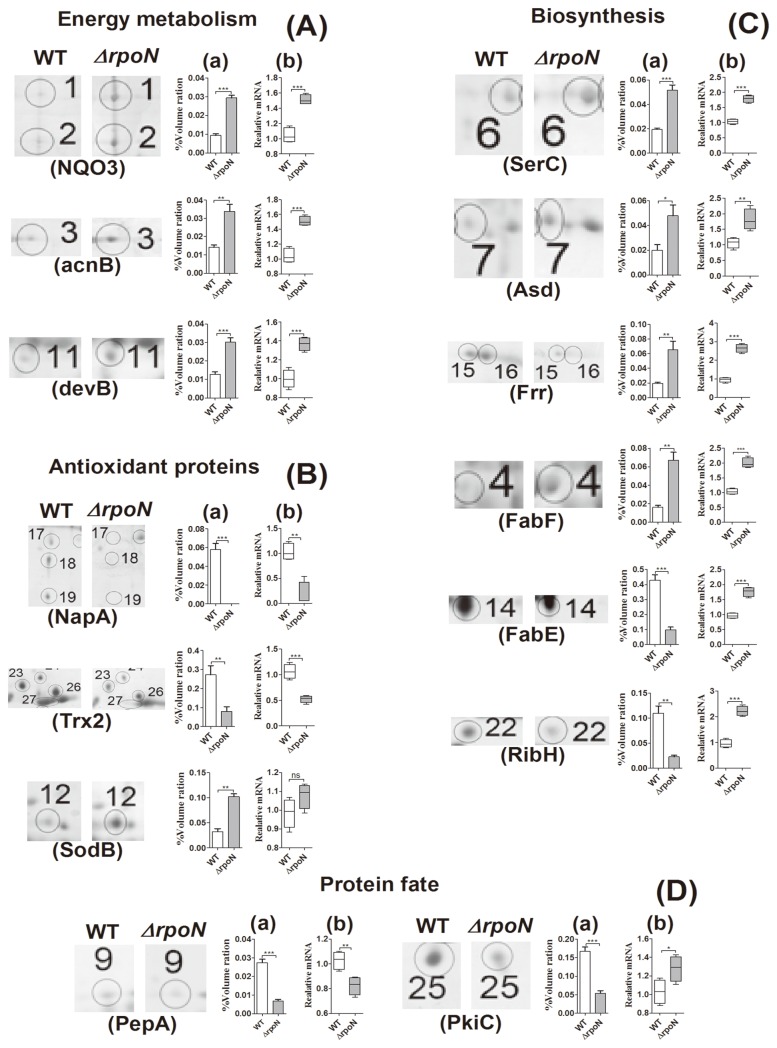
Figure 3. mRNA expression confirms the protein expression of most genes from 2-DE maps.
mRNA and protein levels of the wild-type (WT) and ΔrpoN involved in energy metabolism (A), antioxidation (B), biosynthesis (C) and protein fate (D). (a) Quantification of total protein spot volume ratio from 2-DE analysis; (b) RT-PCR analysis of mRNA levels. Box-and-whisker plots represent the median value with 50% of all data falling within the box. The “whiskers” extend to the 5th and 95th percentiles. Signals were normalized to 16S rRNA levels. Data are mean ± SEM of replicated experiments. *P <0.05, **P <0.01, ***P <0.001.

