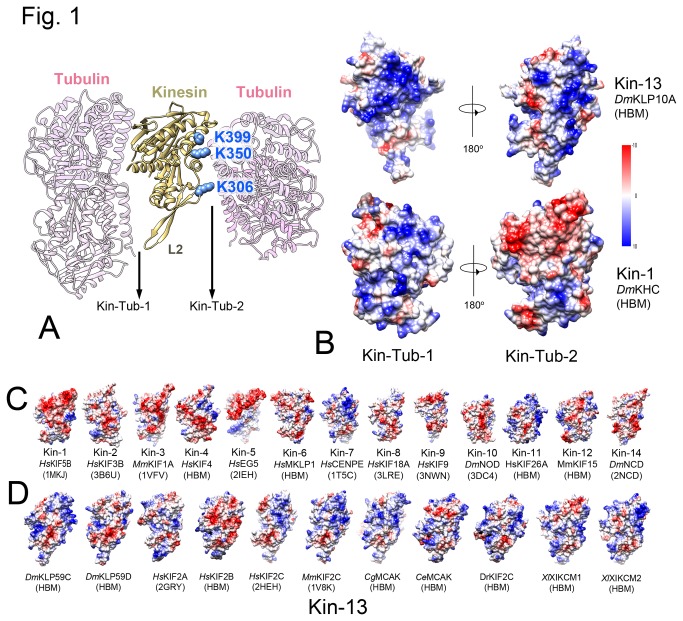
Figure 1. Kinesin HD electrostatic surface potentials in tubulin binding areas.
(A) Ribbon representation of the KLP10AHD-tubulin-MT spiral complex model (PDB IC: 3J2U [10]) showing the two tubulin binding sites at opposite sides of the HD. The Kin-Tub-1 area corresponds to the putative MT binding site, common to all kinesins, but in this case it mediates binding to a curved tubulin protofilament. The Kin-Tub-2 area mediates binding of the kinesin-13-HD-curved-tubulin complex to the MT and the formation of spirals wrapping the MT. Mutating kinesin-13 class conserved positively charged residues in the Kin-Tub-2 area (KLP10A residues K306, K350, and K399 highlighted as blue atom spheres) disrupt these interactions and prevents the spirals from wrapping around MTs [13]. The location of the kinesin-13 Loop-2 (L2) is indicated. (B) Electrostatic surface potential comparison of Kin-Tub-1 and Kin-Tub-2 areas of a kinesin-1 (HsKIF5B) and a kinesin-13 (DmKLP10A). Color scale inset: -10 (red) to +10 (blue) kcal/mol·e. (C) Kin-Tub-2 area of several kinesin families. The corresponding kinesin family is indicated below each HD structure. (D) Kin-Tub-2 area of several kinesin-13s (all within the Kinesin-13B/MCAK subfamily [14]). In B-D the name corresponding to each kinesin sequence are indicated with an italics two letter prefix corresponding to the organism origin (Ce: Caenorhabditis elegans; Cg: Cricetulus griseus; Dr: Danio rerio; Ds: Drosophila melanogaster; Hs: Homo Sapiens; Mm: Mus musculus; Xl: Xenopus laevis) and the PDB IC below (references [46–52]. When no atomic structures were available, a homology based model (HBM) was calculated using the program Modeller [53].

