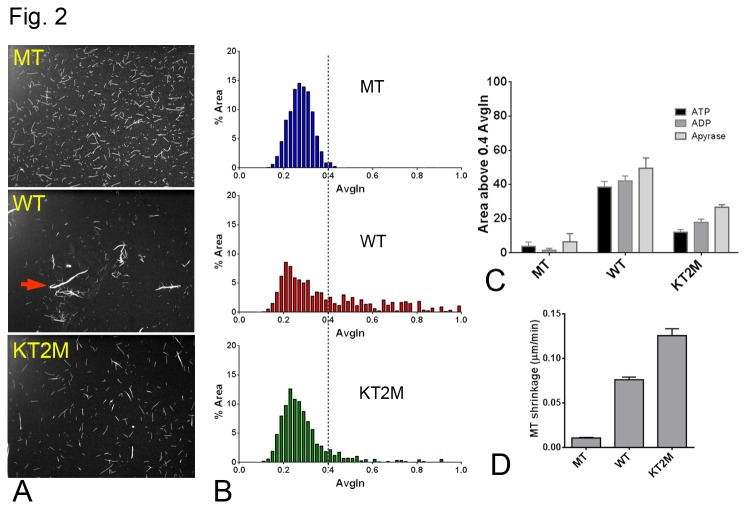
Figure 2. In-vitro bundling and depolymerization assays.
(A) Fluorescent MTs images. Top: MTs without KLP10A; Middle: MTs incubated with KLP10AHD. Red arrow points to a bundle example; Bottom: MTs incubated with mutant KT2M- KLP10AHD. (B) % Area vs. Average fluorescence histogram, (C) MT bundling activity bar plot. The total number of slide images analyzed (N) is 9 for each MT-only condition and 24 for each WT and KT2M conditions. (D) MT shrinkage rate. The total number of microtubules analyzed (N) to estimate the MT shrinkage rate in D is 104,179 and 176 respectively for MT, WT and KT2M.

