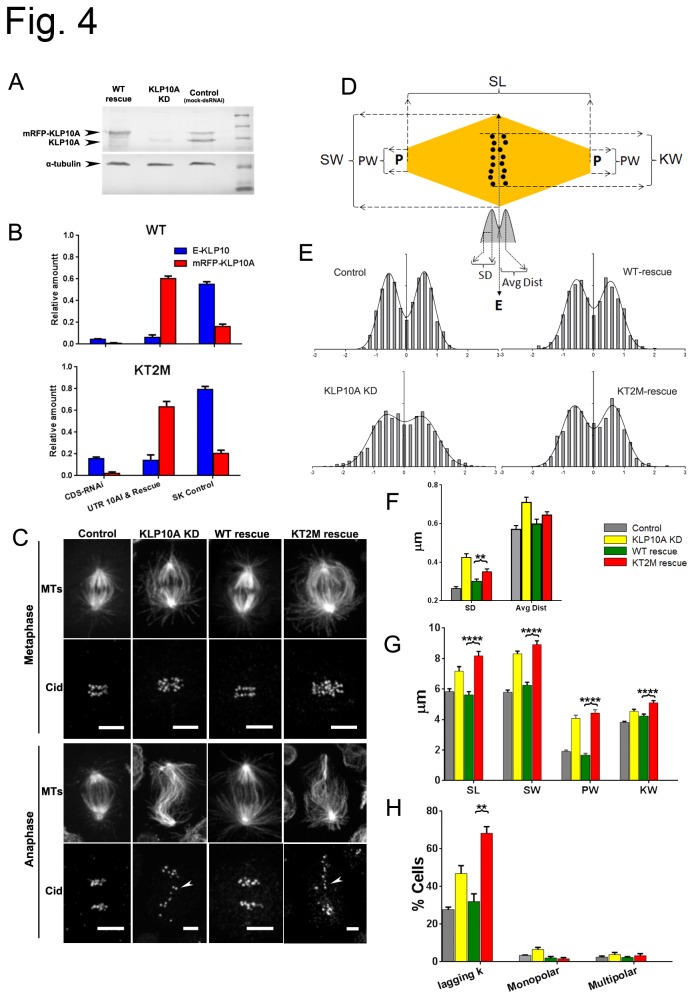
Figure 4. Effect of KLP10A Kin-Tub-2 mutations on S2 cells during mitosis.
(A) Western blot of cell line transfected with mRFP-WT-KLP10A (WT cell line). Lanes: WT-rescue: Cells after dsRNAi treatment against endogenous KLP10A untranslated RNA region and induction of exogenous mRFP-WT-KLP10A expression; KLP10A KD: dsRNAi treatment against KLP10A coding sequence; Control: mock dsRNAi treatment; No-label: molecular weight markers ladder. (B) Relative amount of KLP10A proteins in cell lines containing plasmids for mRFP-WT-KLP10A (top) and mRFP-KT2M-KLP10A (bottom) (N=3). (C) Fluorescent images (GFP-α-tubulin) of representative mitotic spindles. (D) Explanation of evaluated spindle metrics. P: pole, E: equatorial plane. SL: spindle length; SW: spindle width; KW: kinetochore area width; SD: standard deviation of the distribution of kinetochore distances to the equatorial plane. AvgDist: mean distance of kinetochores to the equatorial plane. (E) Distribution of metaphase kinetochore positions for all the cells analyzed (31 in each case). (F) Kinetochore distributions mean SD and AvgDist (N=31). (G) Mean SW, KW and SL (N = 39, 42, 39, 41 respectively for Control, KLP10A-KD, WT-rescue, KT2M-rescue). (H) Mean frequency (%) of cells with lagging kinetochores during anaphase-A, monopolar and multipolar spindles (Number of repeat experiments, N=3 for each case).

