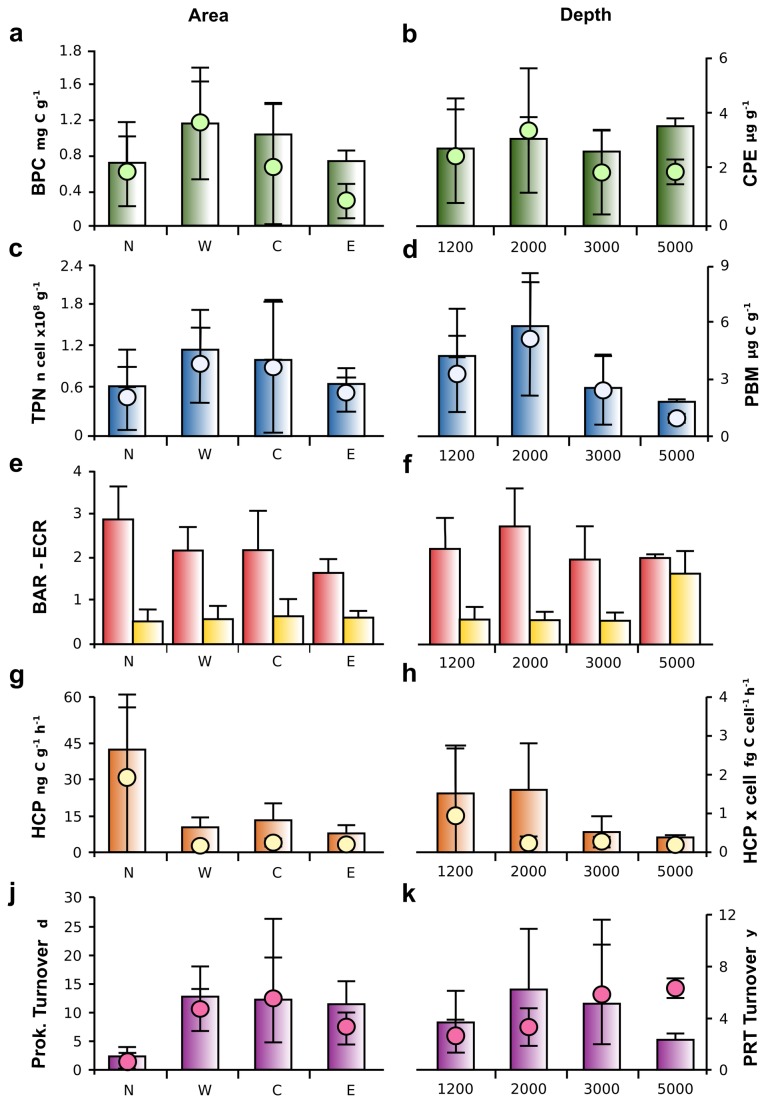
Figure 3. Measured variables across the sampling areas and sampling depths.
Left axes, barplots; right axes, dot plots. (a, b) Biopolymeric carbon (BPC) and chloroplastic pigment equivalent (CPE) according to area (a) and depth (b). (c, d) Total prokaryotic counts (TPN) and prokaryotic biomass (PBM) according to area (c) and depth (d). (e, f) Bacteria to Archaea ratio (BAR) and Euryarchaeota to Crenarchaeota ratio (ECR) according to area (e) and depth (f). (g, h) Heterotrophic production (HCP) and cell specific activity (HCP x cell) calculated on the active cell according to area (g) and depth (h). (j, k) Prokaryotic turnover time and Protein turnover time according to area (j) and depth (k). Means and standard deviations are reported. N, North stations; W, West stations; C, Central stations; E, East stations.

