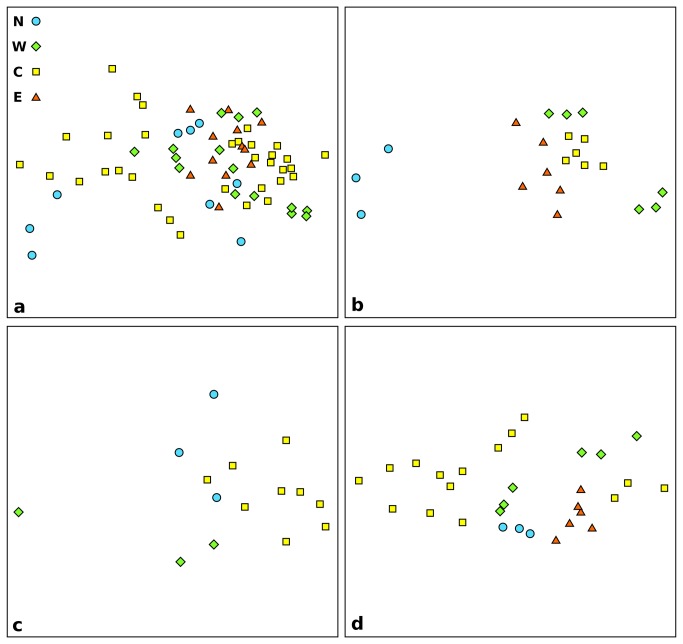
Figure 4. Non-metric multi-dimensional scaling analysis based on the biological descriptors of the prokaryotic community.
The plots show all sampled stations (a), and those at 1,200 m (b), 2,000 m (c) and 3,000 m (d) in depth. N, North stations; W, West stations; C, Central stations; E, East stations.

