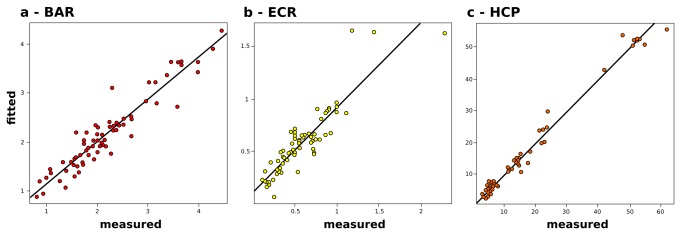
Figure 6. Linear regressions between the measured and GAM fitted values for prokaryotic variables.

(a) Bacteria to Archaea ratio (BAR). (b) Euryarchaeota to Crenarchaeota ratio (ECR). (c) Heterotrophic production (HCP). The Pearson moment correlation coefficients are, respectively: 0.948 (df = 12.3, n = 69), 0.902 (df = 20.2, n = 69) and 0.972 (df = 27.5, n = 60).
