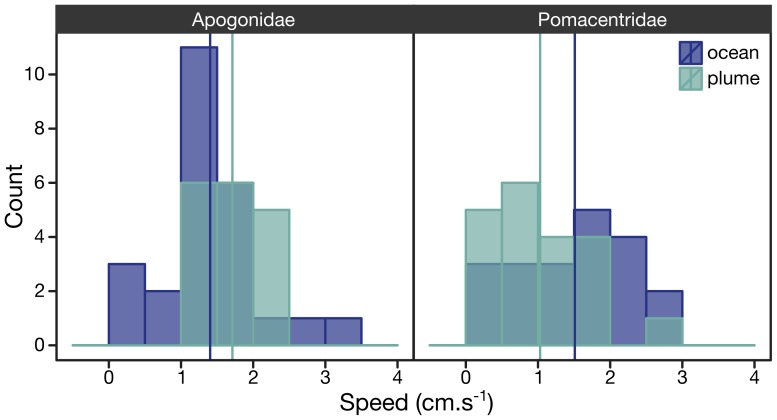
Figure 3. Larval Activity.
Histograms of in situ swimming speed frequencies computed for individual larvae of the Apogonidae (left panel) and Pomacentridae (right panel) families are compared between ocean (blue) and plume (green) water masses. The data are normally distributed and the mean indicated by the vertical solid lines were significantly different for both families (t-test, Table 1); the distributions of speeds in ocean and plume water were significantly different (Kolmogorov-Smirnov, p<10-4) for the Pomacentridae.

