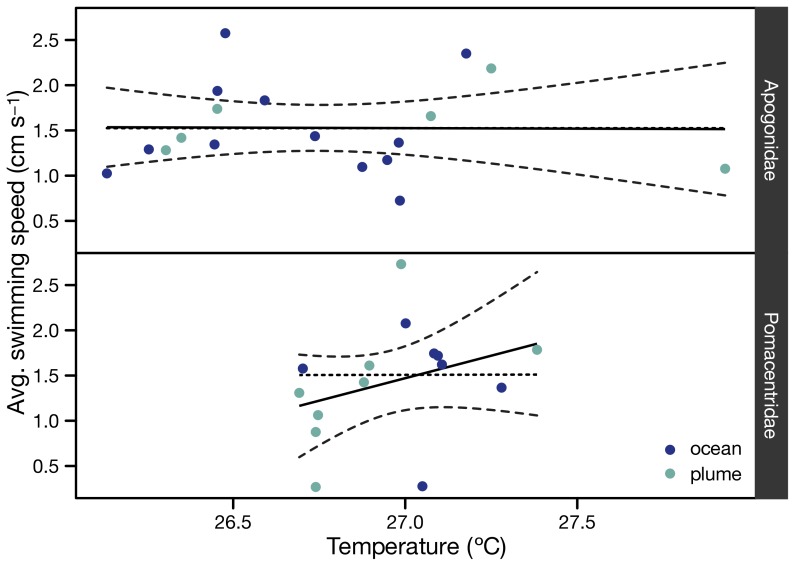
Figure 5. Influence of temperature.
Relationship between temperature and larval swimming speed. Points are temperature averages per deployment. Solid lines are least square regression lines simple linear regression. Grey areas are 95% confidence intervals. The fact that the zero slope dashed lines stay within the confidence intervals shows visually that the regressions are not significant (p = 0.97 for Apogonidae, p = 0.22 for Pomacentridae).

