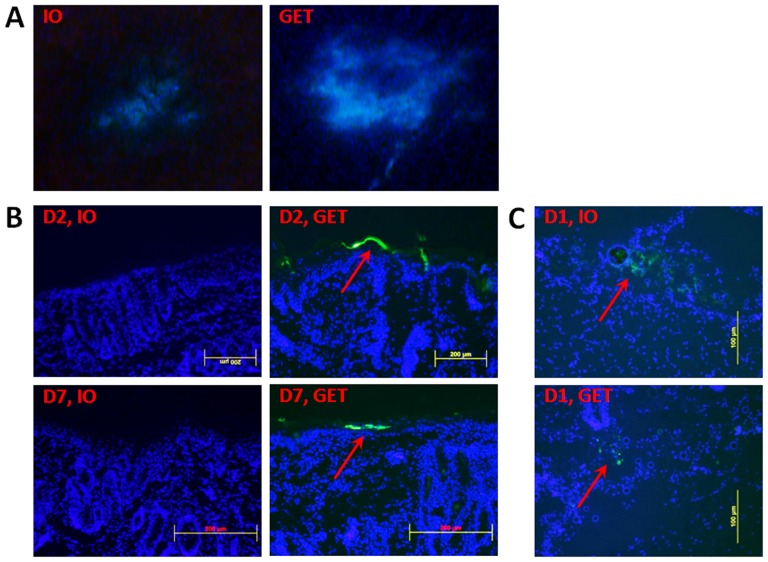
Figure 2. Distribution of GFP-expressing cells in HLGP skin after i.d. DNA injection and non-invasive GET.
Skin samples were collected post-delivery day 1, day 2 or day 7. Samples were analyzed by fluorescent stereoscopy or microscopy. IO: DNA injection only without pulse delivery; GET: DNA injection with pulse delivery. A, One representative picture of 3 treated sites. (B, C) Total 6 cryosections (2 sections per sample) of each delivery were analyzed. Cell nuclei were blue-stained by DAPI. GFP-expressing cells were shown green and indicated by arrow. B, One representative section of each delivery was presented for post-delivery day 2 or day 7(magnification = 100, scale bar = 200 µm). C, One representative section from post-delivery day 1 (magnification = 200, scale bar = 100 µm).

