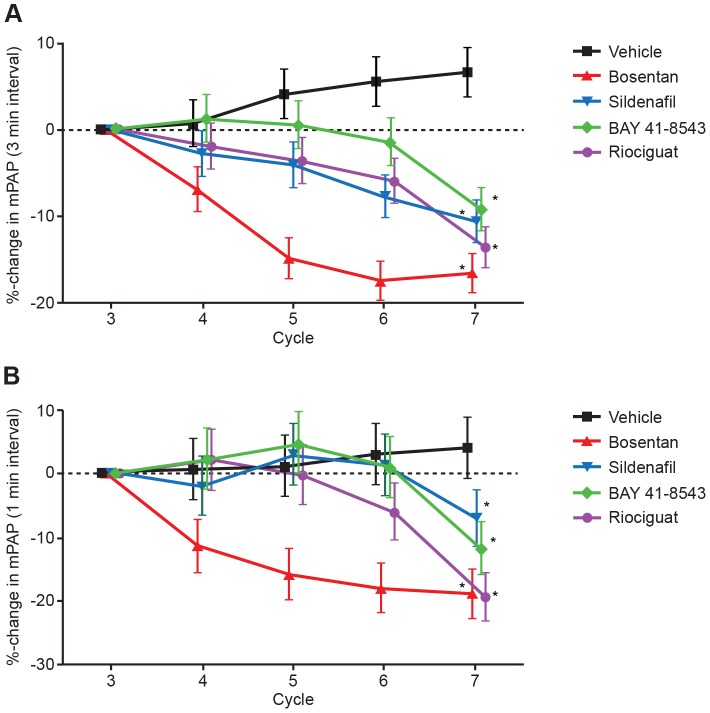
Figure 4. Percentage changes in mPAP.
Percentage changes in mPAP under (A) normal ventilation (3-min observation interval) and (B) the peak of hypoxia induced PAP increase (1-min observation interval) during univentilation cycles versus representative vehicle cycle for each group (mean ± SEM, N = 6). mPAP, mean pulmonary artery pressure; SEM, standard error of the mean. *p<0.05 in treatment group development over time as compared with vehicle.

