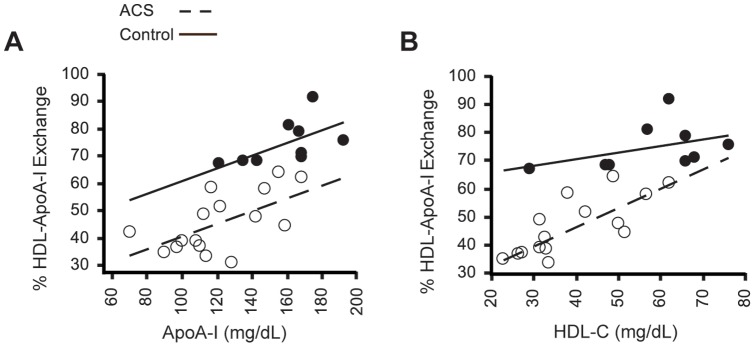
Figure 6. Analysis of HAE in ACS and control subjects with respect to apoA-I and HDL-C levels.

[A] Analysis of HAE with respect to apoA-I for ACS (open circles) and control subjects (closed circles). HAE is highly correlated to apoA-I (r = 0.89; P<0.0001) and increases by 0.23±0.07% for every 1 mg/dL increase in apoA-I in both ACS and control subjects (P = 0.002). HAE of ACS subjects is on average 20±4% lower than control patients with the same apoA-I concentration. [B] Analysis of HAE with respect to HDL-C shows that HAE is also highly correlated to HDL-C (r = 0.90; P<0.0001). For ACS patients, HAE increases by 0.69±0.17% for every 1 mg/dL increase in HDL-C and 0.23±0.19% for control patients (P = 0.0006), but the difference between the slopes is not significant (P = 0.09). Statistical significance was determined by two-way ANOVA, and post hoc comparisons by custom tests of parameters. Interaction p-values greater than 0.20 were dropped in favor of pooled estimates.
