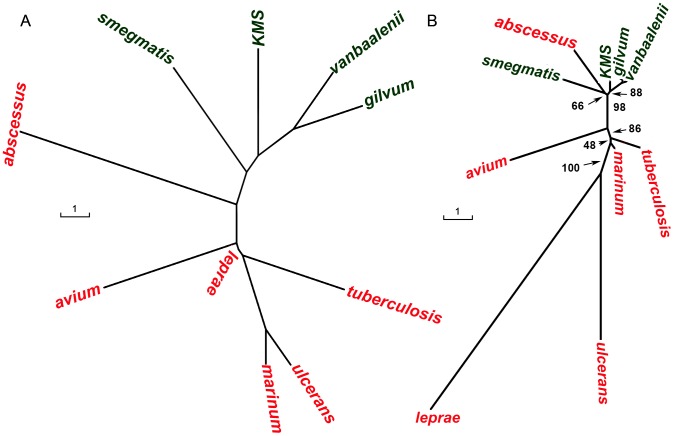
Figure 5. Phylogeny of mycobacteria based on gene content and synteny.
Tree shown in (a) is based on number of orthologs shared among two genomes. The % similarity is based on smallest of the two genomes. Tree shown in (b) is based on order of the core orthologs in each genome. The distance between two genomes is defined as the number of reversals to convert the gene order of one genome into that of the second. The trees are based on the Fitch-Margoliash method.

