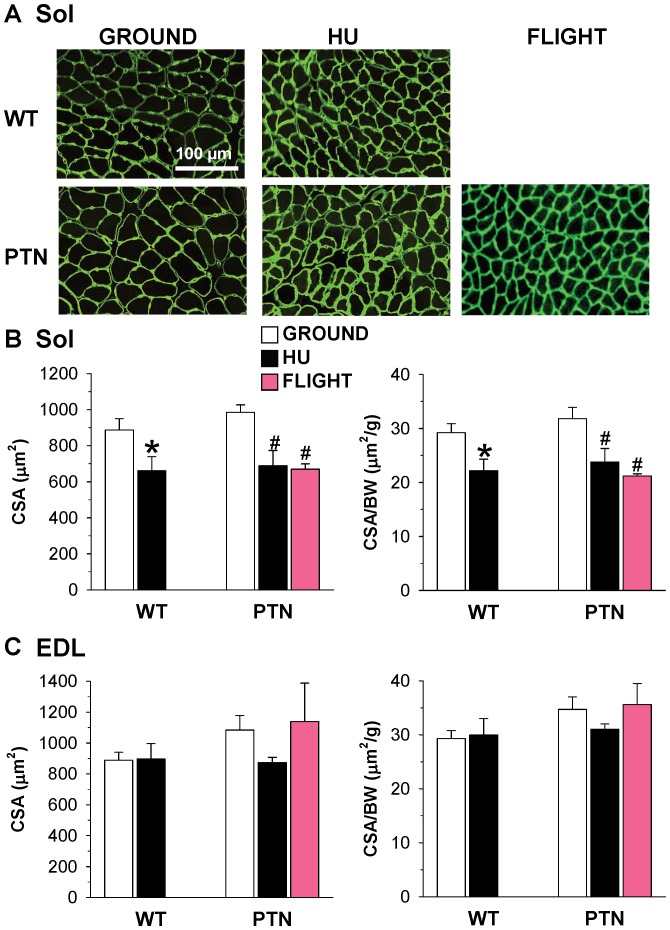
Figure 1. Muscle fiber size of wild-type and PTN-overexpressing mice after 14 days HU or 91 days space flight.
A) representative Sol muscle cryosections stained with antibodies specific for laminin. The area inside the laminin staining was utilized to measure muscle fiber CSA. B) Effect of HU and spaceflight on CSA of Sol fibers and CSA-to-body weight ratio. C) Effect of HU and spaceflight on CSA of EDL fibers and CSA-to-body weight ratio. Each bar is the mean ± SEM from 2 to 9 mice. Statistical analysis, performed with two-tailed unpaired Student’s t test, indicates significant atrophy in soleus muscle of PTN mice after HU or spaceflight (* indicates P<0.05 versus WT-ground mice, and # indicates P<0.05 versus PTN-ground mice).

