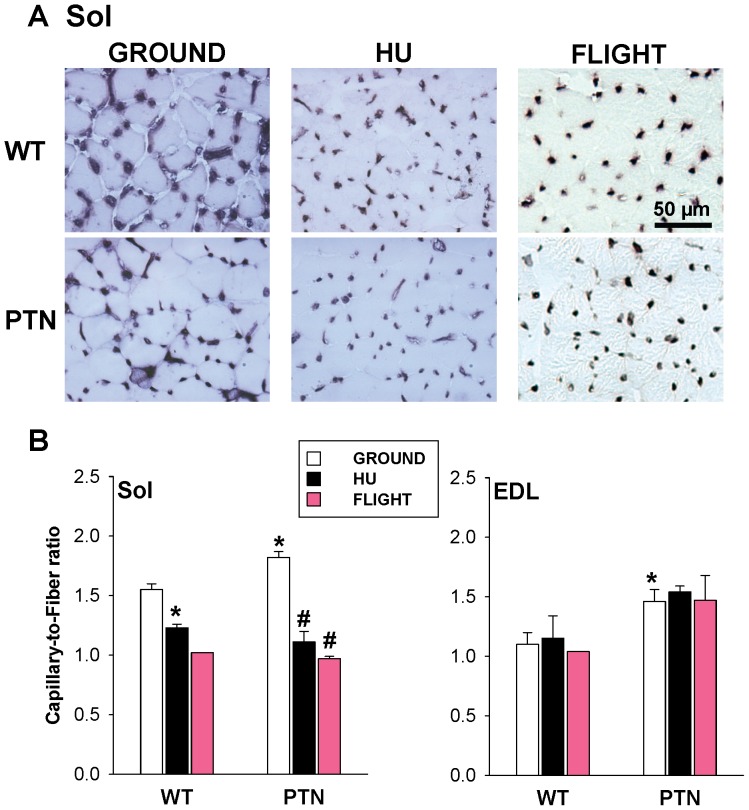
Figure 4. Muscle vascularization in wild-type and PTN-overexpressing mice after 14 days HU or 91 days space flight.
A) Representative Sol muscle sections stained for alkaline phosphatase activity. Pictures of spaceflown samples (right column) were slightly modified using Photoshop software (Adobe) to increase contrast. B) The number of capillary was counted in Sol and EDL muscle sections stained as shown in A and normalized to the number of muscle fibers. Each bars is the mean capillary-to-fiber ratio ± SEM calculated from WT-ground (n = 6), WT-HU (n = 3), WT-spaceflown (n = 1), PTN-ground (n = 6), PTN-HU (n = 3), and PTN-spaceflown (n = 2) mice. Statistical analysis performed with two-tailed unpaired Student’s t test indicates significant change (P<0.05) versus WT-G (*) and PTN-G (#).

