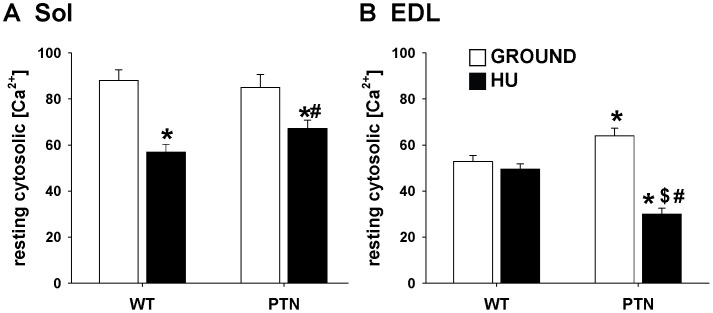
Figure 6. Cytosolic Ca2+ concentration at rest in Sol (A) and EDL (B) muscle fibers of wild-type and PTN-overexpressing mice after 14 days HU.
The cytosolic Ca2+ concentration was determined in mechanically-dissociated muscle fibers with cytofluorescent imaging technique using the Ca2+ dye FURA-2. Each bar is the mean ± SEM calculated from 13-to-47 muscle fibers of 2-to-3 mice. Statistical analysis performed with unpaired Student’s t test indicates significant change (P<0.05) versus WT-G (*), WT-HU ($), and PTN-G (#).

