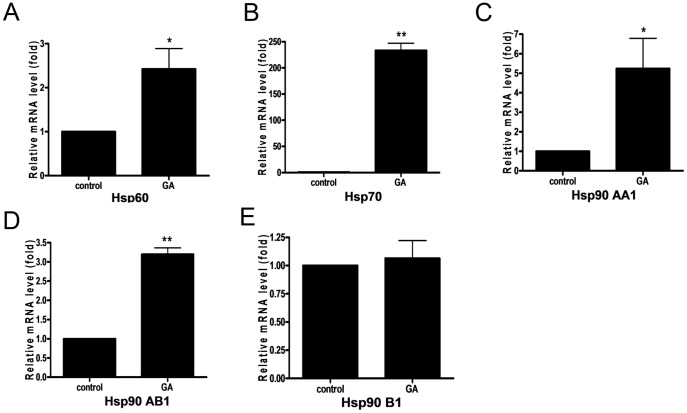
Figure 2. GA affected HSPs gene expression in OS 143B cells.
OS 143B cells were treated with GA (4 µM) for 6 h; the levels of Hsp60, Hsp70, Hsp90AA1, Hsp90AB1, Hsp90B1 transcript were then determined by means of Real Time PCR. Treatment with GA resulted in upregulation of Hsp60 (A), Hsp70 (B), Hsp90AA1 (C), Hsp90AB1 (D) transcript, however it did not impact Hsp90B1 gene expression (E). Values are mean ± SE of three independent experiments, relative mRNA levels of HSP/beta-actin are presented. The data were analyzed by Student's t-test using GraphPad Prism Software version 6.02. *P<0.01, **P<0.001 vs. control.

