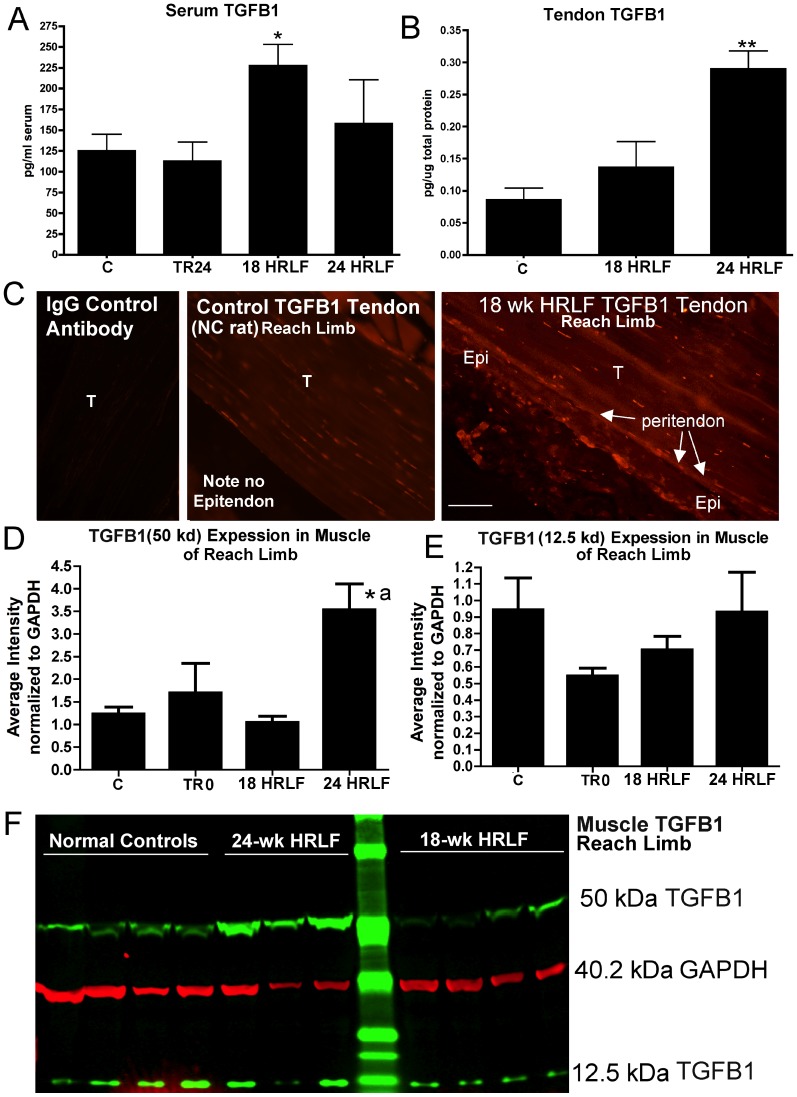
Figure 5. Transforming growth factor beta 1 (TGFB1) in serum and flexor digitorum tissues of the reach limbs.
Groups are as defined in figure legend 2. (A&B) Serum TGFB1 and tendon TGFB1, assayed using ELISA. (C) Immunohistochemical staining for TGFB1 in tendons from NC and 18-week HRLF reach limbs shows localization of TGFB1 in fibroblast-like cells in the peritendon region of both the NC and HRLF rats, and additional stained cells in the epitendon (Epi; thickened in HRLF rats) and endotendon (T) regions of the HRLF rat tendon. (D&E) The results of Western blot analysis of muscle TGFB1 in which two bands were detected, 50 kDa and 12.5 kDa. The ratio of each band of TGFB1 normalized to GAPDH levels is shown for three replicates of the western blot. (F) A representative Western blot of reach limb muscles from normal controls (NC, n = 4 shown), 24-week HRLF rats (n = 3 shown), and 18-week HRLF rats (n = 4 shown), probed with anti-TGFB1 and GAPDH. Green bands were detected with an anti-TGFB1 antibody and a secondary antibody tagged with IRDye800CW (Li-Cor, #.926-32211). Red bands were detected with an anti-GAPDH antibody and a secondary antibody tagged IRDye680LT (Li-Cor, #926-68020). Symbols: *:p<0.05, **:p<0.01, compared to age-matched control rats; a: p<0.05, compared to TR24 rats. Scale bar = 50 micrometers.

