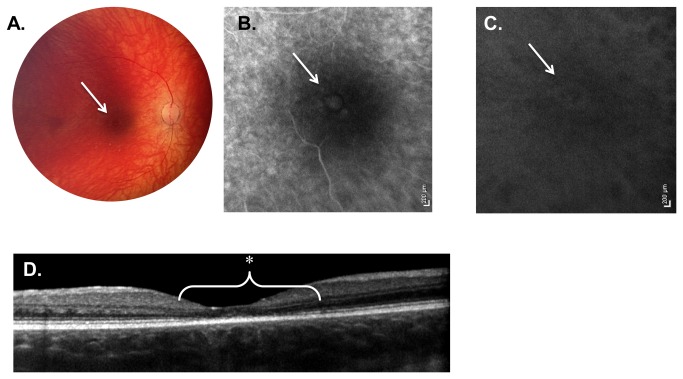
Figure 3. Weill Cornell LINCL Ophthalmic Severity Score 3.
A. Dilated fundus photograph of patient 7 reveals a central area of pigmentary change in the fovea (arrow). The optic nerve is somewhat pale in appearance with retinal vessels beginning to show signs of attenuation. B. Late-phase FA and C. ICGA of the same patient show a more prominent area of central hyper-fluorescence (arrow) surrounded by hypo-fluorescence. A few areas of pinpoint hyper-fluorescence outside this ring are also evident. D. SD-OCT of patient 7 demonstrates outer retinal abnormalities, including the disruption of the ellipsoid hyper-reflective band (*) as well as the external limiting membrane. This outer retinal atrophy is confined to the central fovea, extending less than 1 disc diameter. FA – fluorescein angiogram, ICGA - indocyanine green angiogram, SD-OCT – spectral domain optical coherence tomography.

